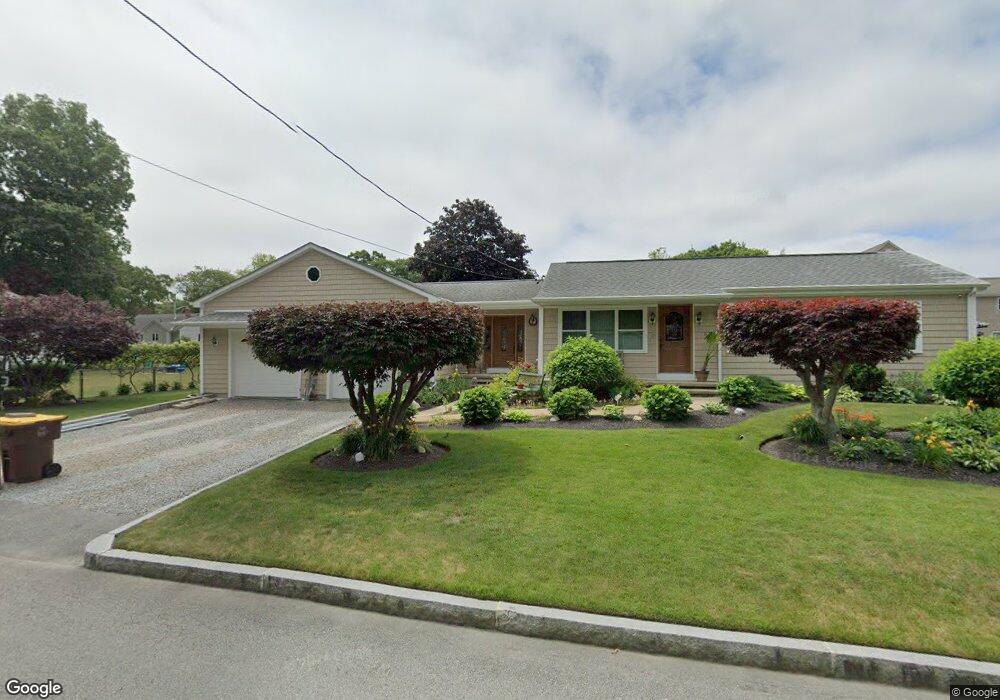
183 David St Fall River, MA 02720
Bank Street NeighborhoodEstimated Value: $389,000 - $446,000
2
Beds
1
Bath
1,032
Sq Ft
$408/Sq Ft
Est. Value
About This Home
This home is located at 183 David St, Fall River, MA 02720 and is currently estimated at $421,178, approximately $408 per square foot. 183 David St is a home located in Bristol County with nearby schools including Mary Fonseca Elementary School, Talbot Innovation School, and B M C Durfee High School.
Ownership History
Date
Name
Owned For
Owner Type
Purchase Details
Closed on
Mar 30, 1998
Sold by
Thompson Rose C
Bought by
Mauricio Jose P and Mauricio Susan
Current Estimated Value
Home Financials for this Owner
Home Financials are based on the most recent Mortgage that was taken out on this home.
Original Mortgage
$88,000
Interest Rate
6.96%
Mortgage Type
Purchase Money Mortgage
Create a Home Valuation Report for This Property
The Home Valuation Report is an in-depth analysis detailing your home's value as well as a comparison with similar homes in the area
Home Values in the Area
Average Home Value in this Area
Purchase History
| Date | Buyer | Sale Price | Title Company |
|---|---|---|---|
| Mauricio Jose P | $110,000 | -- |
Source: Public Records
Mortgage History
| Date | Status | Borrower | Loan Amount |
|---|---|---|---|
| Open | Mauricio Jose P | $85,000 | |
| Closed | Mauricio Jose P | $86,500 | |
| Closed | Mauricio Jose P | $88,000 |
Source: Public Records
Tax History
| Year | Tax Paid | Tax Assessment Tax Assessment Total Assessment is a certain percentage of the fair market value that is determined by local assessors to be the total taxable value of land and additions on the property. | Land | Improvement |
|---|---|---|---|---|
| 2025 | $4,688 | $409,400 | $139,500 | $269,900 |
| 2024 | $4,397 | $382,700 | $134,200 | $248,500 |
| 2023 | $4,198 | $342,100 | $120,500 | $221,600 |
| 2022 | $3,717 | $294,500 | $111,500 | $183,000 |
| 2021 | $3,749 | $271,100 | $105,300 | $165,800 |
| 2020 | $3,621 | $250,600 | $101,400 | $149,200 |
| 2019 | $3,517 | $241,200 | $101,400 | $139,800 |
| 2018 | $3,393 | $232,100 | $101,400 | $130,700 |
| 2017 | $3,221 | $230,100 | $101,400 | $128,700 |
| 2016 | $3,057 | $224,300 | $101,400 | $122,900 |
| 2015 | $2,837 | $216,900 | $94,800 | $122,100 |
| 2014 | $2,729 | $216,900 | $94,800 | $122,100 |
Source: Public Records
Map
Nearby Homes
Your Personal Tour Guide
Ask me questions while you tour the home.