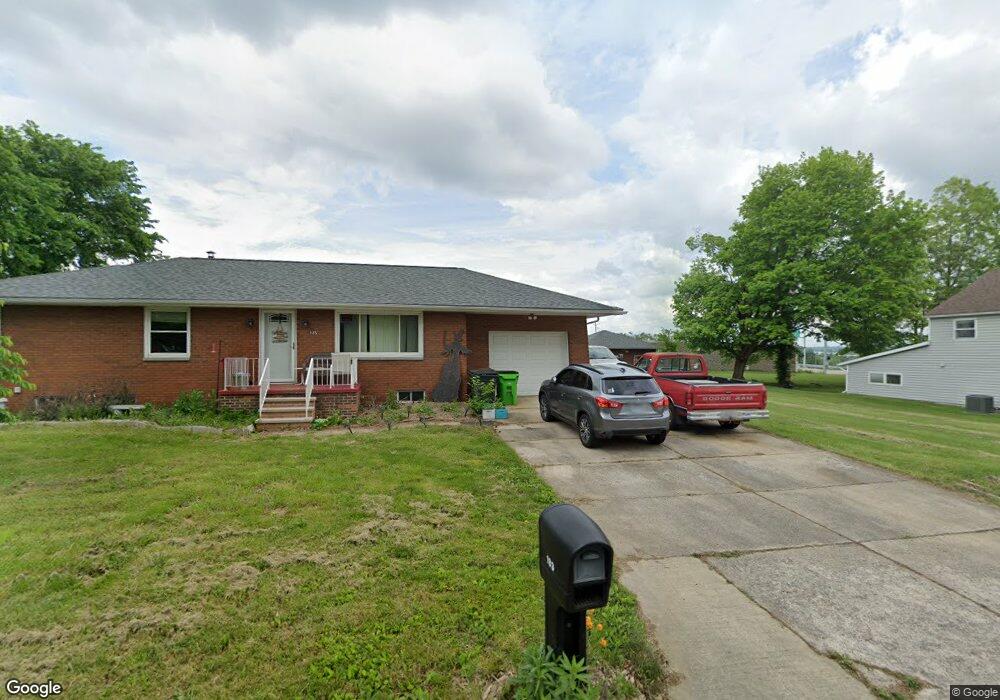
183 Elmwood Ave Barberton, OH 44203
North Barberton NeighborhoodEstimated Value: $147,000 - $164,148
3
Beds
2
Baths
1,008
Sq Ft
$157/Sq Ft
Est. Value
About This Home
This home is located at 183 Elmwood Ave, Barberton, OH 44203 and is currently estimated at $158,037, approximately $156 per square foot. 183 Elmwood Ave is a home located in Summit County with nearby schools including Barberton Middle School, Barberton Intermediate School 3-5, and Barberton High School.
Ownership History
Date
Name
Owned For
Owner Type
Purchase Details
Closed on
Feb 23, 2020
Sold by
Decarlo Glenda L
Bought by
Patterson Joseph
Current Estimated Value
Home Financials for this Owner
Home Financials are based on the most recent Mortgage that was taken out on this home.
Original Mortgage
$98,090
Outstanding Balance
$88,272
Interest Rate
4.5%
Mortgage Type
FHA
Estimated Equity
$69,765
Purchase Details
Closed on
Jun 28, 2011
Sold by
Secretary Of Veterans Affairs
Bought by
Decarlo Glenda L
Purchase Details
Closed on
Dec 14, 2010
Sold by
Labant Michael D
Bought by
Secretary Of Veterans Affairs
Purchase Details
Closed on
Apr 25, 2007
Sold by
Black Darlak Artis L and Darlak Robert
Bought by
Labant Michael D
Home Financials for this Owner
Home Financials are based on the most recent Mortgage that was taken out on this home.
Original Mortgage
$127,687
Interest Rate
6.18%
Mortgage Type
VA
Purchase Details
Closed on
Nov 16, 2004
Sold by
Estate Of Arthur L Black
Bought by
Black Darlak Artis L
Create a Home Valuation Report for This Property
The Home Valuation Report is an in-depth analysis detailing your home's value as well as a comparison with similar homes in the area
Home Values in the Area
Average Home Value in this Area
Purchase History
| Date | Buyer | Sale Price | Title Company |
|---|---|---|---|
| Patterson Joseph | $99,900 | Buckeye Reserve Title Agency | |
| Decarlo Glenda L | -- | Buckeye Reserve Title Agency | |
| Secretary Of Veterans Affairs | $92,537 | None Available | |
| Labant Michael D | $125,000 | Chicago Title Insurance Co | |
| Black Darlak Artis L | -- | C&J Title |
Source: Public Records
Mortgage History
| Date | Status | Borrower | Loan Amount |
|---|---|---|---|
| Open | Patterson Joseph | $98,090 | |
| Previous Owner | Labant Michael D | $127,687 |
Source: Public Records
Tax History Compared to Growth
Tax History
| Year | Tax Paid | Tax Assessment Tax Assessment Total Assessment is a certain percentage of the fair market value that is determined by local assessors to be the total taxable value of land and additions on the property. | Land | Improvement |
|---|---|---|---|---|
| 2025 | $2,358 | $43,971 | $10,815 | $33,156 |
| 2024 | $2,358 | $43,971 | $10,815 | $33,156 |
| 2023 | $2,358 | $43,971 | $10,815 | $33,156 |
| 2022 | $1,840 | $29,400 | $7,070 | $22,330 |
| 2021 | $1,738 | $29,400 | $7,070 | $22,330 |
| 2020 | $1,595 | $27,550 | $7,070 | $20,480 |
| 2019 | $2,146 | $33,570 | $12,030 | $21,540 |
| 2018 | $2,254 | $35,800 | $12,030 | $23,770 |
| 2017 | $2,334 | $35,800 | $12,030 | $23,770 |
| 2016 | $2,339 | $35,800 | $12,030 | $23,770 |
| 2015 | $2,334 | $35,800 | $12,030 | $23,770 |
| 2014 | $2,317 | $35,800 | $12,030 | $23,770 |
| 2013 | $1,655 | $26,220 | $4,570 | $21,650 |
Source: Public Records
Map
Nearby Homes
- 117 Fernwood Ave
- 103 & 103 1/2 Fernwood Ave
- 0 Romig Ave
- 1515 Grand Blvd
- 76 Hazelwood Ave
- 1150 Wooster Rd N
- 2714 Romig Rd
- 143 Glenn St
- 172 & 173 Belcher Ave
- 277 Glenn St
- 1453 Woodbirch Ave
- 818 N Summit St
- 1392 Belcher Ave
- 30 W Hiram St
- 137 Hermann St
- 146 Hermann St
- 1315 Kohler Ave
- 2518 30th St SW
- 1924 Caroline Ave
- 1295 Kohler Ave
- 183 Elmwood Ave
- 183 Elmwood Ave
- 183 Elmwood Ave
- 183 Elmwood Ave
- 183 Elmwood Ave
- 183 Elmwood Ave
- 183 Elmwood Ave
- 183 Elmwood Ave
- 191 Elmwood Ave
- 366 W State St
- 366 W State St
- 192 Elmwood Ave
- 201 Elmwood Ave
- 374 W State St
- 356 W State St
- 207 Elmwood Ave
- 348 W State St
- 342 W State St
- 143 Elmwood Ave
- 154 Elmwood Ave