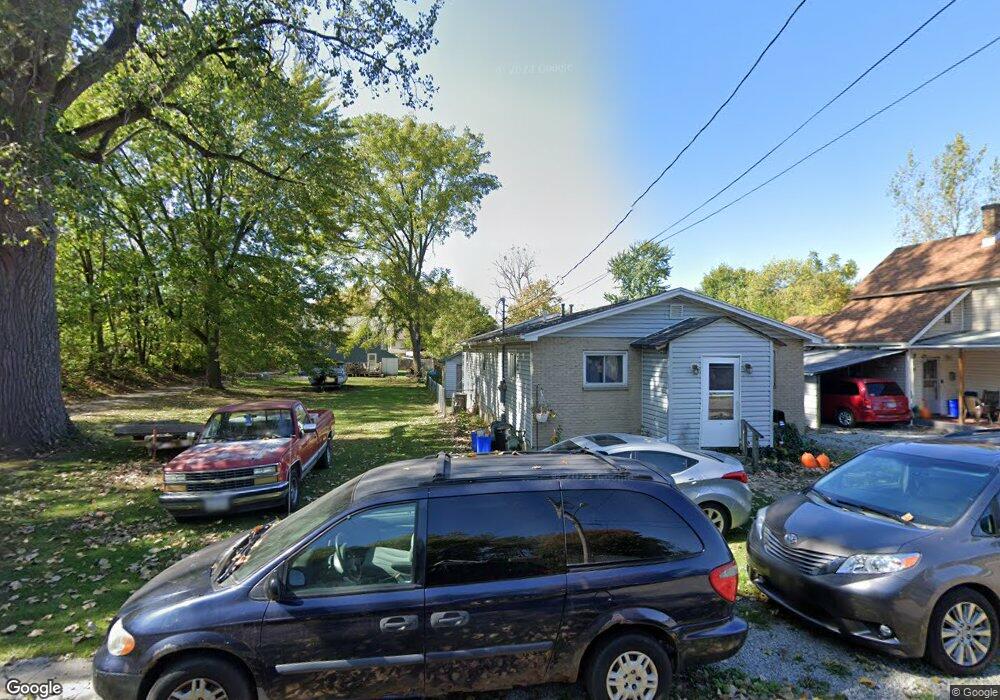
183 Erie St Marion, OH 43302
Estimated Value: $35,000 - $101,000
2
Beds
1
Bath
864
Sq Ft
$90/Sq Ft
Est. Value
About This Home
This home is located at 183 Erie St, Marion, OH 43302 and is currently estimated at $77,667, approximately $89 per square foot. 183 Erie St is a home located in Marion County with nearby schools including James A. Garfield Elementary School, Ulysses S. Grant Middle School, and Harding High School.
Ownership History
Date
Name
Owned For
Owner Type
Purchase Details
Closed on
Oct 25, 2021
Sold by
Marion County Land Reutilization Corp
Bought by
Janson Melissa and Janson Derek J
Current Estimated Value
Purchase Details
Closed on
Oct 26, 2005
Sold by
Hemp Jamie L and Webb James K
Bought by
Webb James K and Webb Jamie L
Home Financials for this Owner
Home Financials are based on the most recent Mortgage that was taken out on this home.
Original Mortgage
$57,400
Interest Rate
8.04%
Mortgage Type
Adjustable Rate Mortgage/ARM
Purchase Details
Closed on
Dec 16, 2003
Bought by
Webb James K and Surv Jamie L
Purchase Details
Closed on
Jun 9, 2003
Bought by
Webb James K and Surv Jamie L
Purchase Details
Closed on
Dec 11, 2002
Bought by
Webb James K and Surv Jamie L
Purchase Details
Closed on
Nov 19, 1998
Bought by
Webb James K and Surv Jamie L
Purchase Details
Closed on
Aug 2, 1993
Bought by
Webb James K and Surv Jamie L
Create a Home Valuation Report for This Property
The Home Valuation Report is an in-depth analysis detailing your home's value as well as a comparison with similar homes in the area
Home Values in the Area
Average Home Value in this Area
Purchase History
| Date | Buyer | Sale Price | Title Company |
|---|---|---|---|
| Janson Melissa | -- | None Available | |
| Webb James K | -- | None Available | |
| Webb James K | $34,000 | -- | |
| Webb James K | $17,000 | -- | |
| Webb James K | $20,000 | -- | |
| Webb James K | -- | -- | |
| Webb James K | $5,000 | -- |
Source: Public Records
Mortgage History
| Date | Status | Borrower | Loan Amount |
|---|---|---|---|
| Previous Owner | Webb James K | $57,400 |
Source: Public Records
Tax History Compared to Growth
Tax History
| Year | Tax Paid | Tax Assessment Tax Assessment Total Assessment is a certain percentage of the fair market value that is determined by local assessors to be the total taxable value of land and additions on the property. | Land | Improvement |
|---|---|---|---|---|
| 2024 | $67 | $1,700 | $1,700 | $0 |
| 2023 | $67 | $1,700 | $1,700 | $0 |
| 2022 | $62 | $1,700 | $1,700 | $0 |
| 2021 | $59 | $1,480 | $1,480 | $0 |
| 2020 | $59 | $1,480 | $1,480 | $0 |
| 2019 | $59 | $1,480 | $1,480 | $0 |
| 2018 | $0 | $1,390 | $1,390 | $0 |
| 2017 | $0 | $11,780 | $1,390 | $10,390 |
| 2016 | $460 | $11,850 | $1,460 | $10,390 |
| 2015 | $471 | $11,860 | $1,390 | $10,470 |
| 2014 | $472 | $11,860 | $1,390 | $10,470 |
| 2012 | $632 | $15,810 | $1,530 | $14,280 |
Source: Public Records
Map
Nearby Homes
- 178 Leader St
- 325 Holmes Place
- 343 Commercial St
- 347 Mary St
- 374 Nunin Ct
- 233 Tully St
- 302 Blaine Ave
- 429 W Columbia St
- 314 Windsor St
- 229 W Columbia St
- 395 N Main St
- 341 Girard Ave
- 468 Avondale Ave
- 551 Universal Ave Unit 555
- 393 Windsor St
- 213 Sharp St
- 343 S Prospect St
- 485 Avondale Ave
- 434 N State St
- 389 S Prospect St