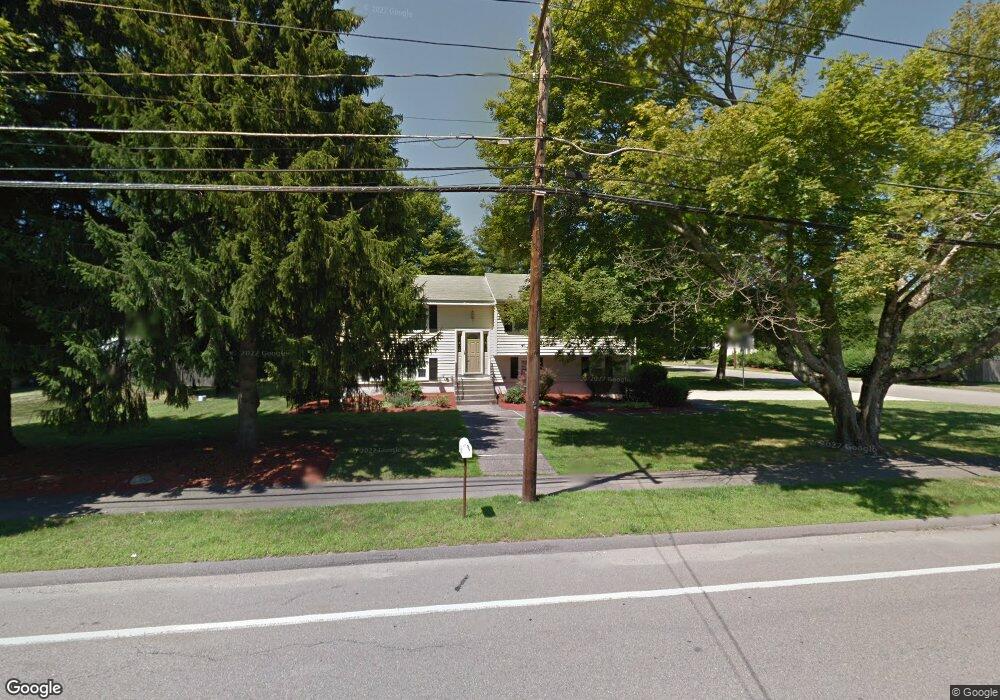
183 Fisher St Walpole, MA 02081
Estimated Value: $675,000 - $765,000
3
Beds
2
Baths
1,294
Sq Ft
$549/Sq Ft
Est. Value
About This Home
This home is located at 183 Fisher St, Walpole, MA 02081 and is currently estimated at $710,683, approximately $549 per square foot. 183 Fisher St is a home located in Norfolk County with nearby schools including Fisher School, Walpole Middle School, and Walpole High School.
Ownership History
Date
Name
Owned For
Owner Type
Purchase Details
Closed on
Apr 27, 2022
Sold by
Lamorte Anthony A and Lamorte Julie L
Bought by
Julie L Lamorte Ret
Current Estimated Value
Create a Home Valuation Report for This Property
The Home Valuation Report is an in-depth analysis detailing your home's value as well as a comparison with similar homes in the area
Home Values in the Area
Average Home Value in this Area
Purchase History
| Date | Buyer | Sale Price | Title Company |
|---|---|---|---|
| Julie L Lamorte Ret | -- | None Available |
Source: Public Records
Tax History Compared to Growth
Tax History
| Year | Tax Paid | Tax Assessment Tax Assessment Total Assessment is a certain percentage of the fair market value that is determined by local assessors to be the total taxable value of land and additions on the property. | Land | Improvement |
|---|---|---|---|---|
| 2025 | $8,075 | $629,400 | $340,200 | $289,200 |
| 2024 | $7,894 | $597,100 | $327,100 | $270,000 |
| 2023 | $7,524 | $541,700 | $284,400 | $257,300 |
| 2022 | $7,110 | $491,700 | $263,400 | $228,300 |
| 2021 | $6,838 | $460,800 | $248,500 | $212,300 |
| 2020 | $6,763 | $451,200 | $234,400 | $216,800 |
| 2019 | $6,522 | $431,900 | $225,400 | $206,500 |
| 2018 | $6,207 | $406,500 | $217,400 | $189,100 |
| 2017 | $6,003 | $391,600 | $209,100 | $182,500 |
| 2016 | $5,846 | $375,700 | $201,500 | $174,200 |
| 2015 | $5,621 | $358,000 | $192,000 | $166,000 |
| 2014 | $5,355 | $339,800 | $192,000 | $147,800 |
Source: Public Records
Map
Nearby Homes
- 66 Gould St
- 22 Coolidge Rd
- 291 Plimpton St
- 531 Walpole St
- 19 and 23 Arlington Ln
- 634 Main St Unit 14
- 21 Spear Ave
- 4 Lost Brook Trail
- 7 Washington Green
- 363 - 367 Washington St
- 4403 Pennington Dr Unit 4403
- 20 Rockhill St
- 20 Rockhill St
- 1080 North St
- 486 Washington St
- 17 Bridle Path
- 70 Endicott St Unit 404
- 70 Endicott St Unit 1306
- 2 Alexandra Way
- 18 Laurel Rd