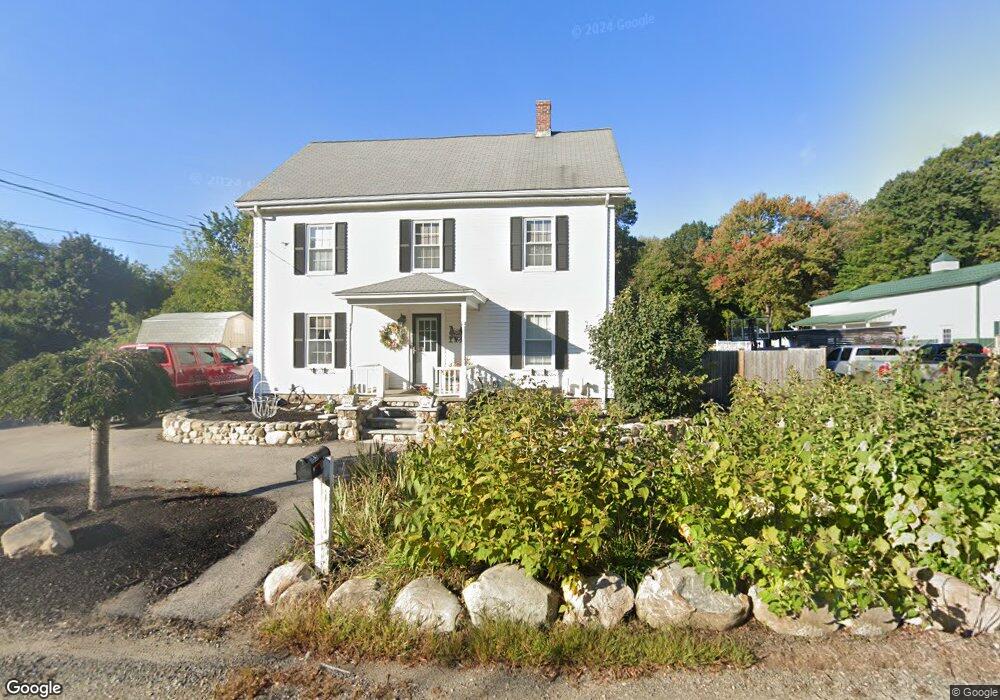
183 Haverhill St Rowley, MA 01969
Estimated Value: $892,639 - $1,078,000
4
Beds
2
Baths
2,456
Sq Ft
$392/Sq Ft
Est. Value
About This Home
This home is located at 183 Haverhill St, Rowley, MA 01969 and is currently estimated at $963,410, approximately $392 per square foot. 183 Haverhill St is a home located in Essex County with nearby schools including Triton Regional High School, North Shore Montessori School, and Clark School.
Ownership History
Date
Name
Owned For
Owner Type
Purchase Details
Closed on
Jan 18, 2019
Sold by
Maffei Gregory K and Maffei Laurie
Bought by
183 Haverhill Street Rt
Current Estimated Value
Purchase Details
Closed on
Sep 23, 2016
Sold by
183 Haverhill Street R
Bought by
Maffei Gregory K and Maffei Laurie
Home Financials for this Owner
Home Financials are based on the most recent Mortgage that was taken out on this home.
Original Mortgage
$338,000
Interest Rate
3.45%
Mortgage Type
New Conventional
Purchase Details
Closed on
Mar 1, 2013
Sold by
Maffei Laurie and Maffei Gregory K
Bought by
183 Haverhill Street R
Purchase Details
Closed on
Dec 11, 2003
Sold by
Endicott Rt and Sears John E
Bought by
Coan Anne
Purchase Details
Closed on
Aug 25, 2003
Sold by
Walker Mark J and Walker Michelle C
Bought by
Edwards Ross and Maffei Laurie
Purchase Details
Closed on
Jul 30, 1999
Sold by
Sheehan Family Nt and True Susan M
Bought by
Endicott Rt and Sears John E
Create a Home Valuation Report for This Property
The Home Valuation Report is an in-depth analysis detailing your home's value as well as a comparison with similar homes in the area
Home Values in the Area
Average Home Value in this Area
Purchase History
| Date | Buyer | Sale Price | Title Company |
|---|---|---|---|
| 183 Haverhill Street Rt | -- | None Available | |
| Maffei Gregory K | -- | -- | |
| 183 Haverhill Street R | -- | -- | |
| Coan Anne | $310,000 | -- | |
| Edwards Ross | $408,000 | -- | |
| Endicott Rt | $307,500 | -- |
Source: Public Records
Mortgage History
| Date | Status | Borrower | Loan Amount |
|---|---|---|---|
| Previous Owner | Maffei Gregory K | $338,000 | |
| Previous Owner | Endicott Rt | $30,000 | |
| Previous Owner | Endicott Rt | $391,000 |
Source: Public Records
Tax History Compared to Growth
Tax History
| Year | Tax Paid | Tax Assessment Tax Assessment Total Assessment is a certain percentage of the fair market value that is determined by local assessors to be the total taxable value of land and additions on the property. | Land | Improvement |
|---|---|---|---|---|
| 2025 | $8,331 | $707,800 | $303,100 | $404,700 |
| 2024 | $8,192 | $677,000 | $288,700 | $388,300 |
| 2023 | $7,918 | $590,400 | $250,900 | $339,500 |
| 2022 | $7,199 | $492,400 | $208,900 | $283,500 |
| 2021 | $6,995 | $449,000 | $181,900 | $267,100 |
| 2020 | $7,056 | $452,900 | $173,500 | $279,400 |
| 2019 | $6,227 | $424,200 | $173,500 | $250,700 |
| 2018 | $5,917 | $405,800 | $173,500 | $232,300 |
| 2017 | $5,738 | $405,800 | $173,500 | $232,300 |
| 2016 | $5,587 | $389,100 | $150,700 | $238,400 |
| 2015 | $5,344 | $375,300 | $150,700 | $224,600 |
Source: Public Records
Map
Nearby Homes
- 8 Longmeadow Dr Unit 14
- 19 Morphew Ln Unit 2
- 47 Prospect St
- 78 Wethersfield St
- 79 Spencer Knowles Rd
- 480 Newburyport Turnpike
- 75 Country Club Way
- 460 - 472 Newburyport Turnpike
- 21 Hammond St
- 1 Court Ln
- 3 Choate Ln
- 196 Country Club Way
- 304 & 480 Wethersfield St & Nbpt Tnpk
- 304-312 Wethersfield St
- 308 & 312 Wethersfield St
- Lot 4 Osprey Ct
- Lot 3 Osprey Ct
- 1 Osprey Ct
- 76-78 Daniels Rd
- 601 Newburyport Turnpike
- 183R Haverhill St
- 185 Haverhill St
- 190 Haverhill St
- 174 Haverhill St
- 167 Haverhill St
- 178 Haverhill St
- 196 Haverhill St
- 201 Haverhill St
- 165 Haverhill St
- 202 Haverhill St
- 195 Haverhill St
- 164 Haverhill St
- 171 Haverhill St
- 159 Haverhill St
- 206 Haverhill St
- 162 Haverhill St
- 212 Haverhill St
- 155 Haverhill St
- 147 Haverhill St
- 143 Haverhill St