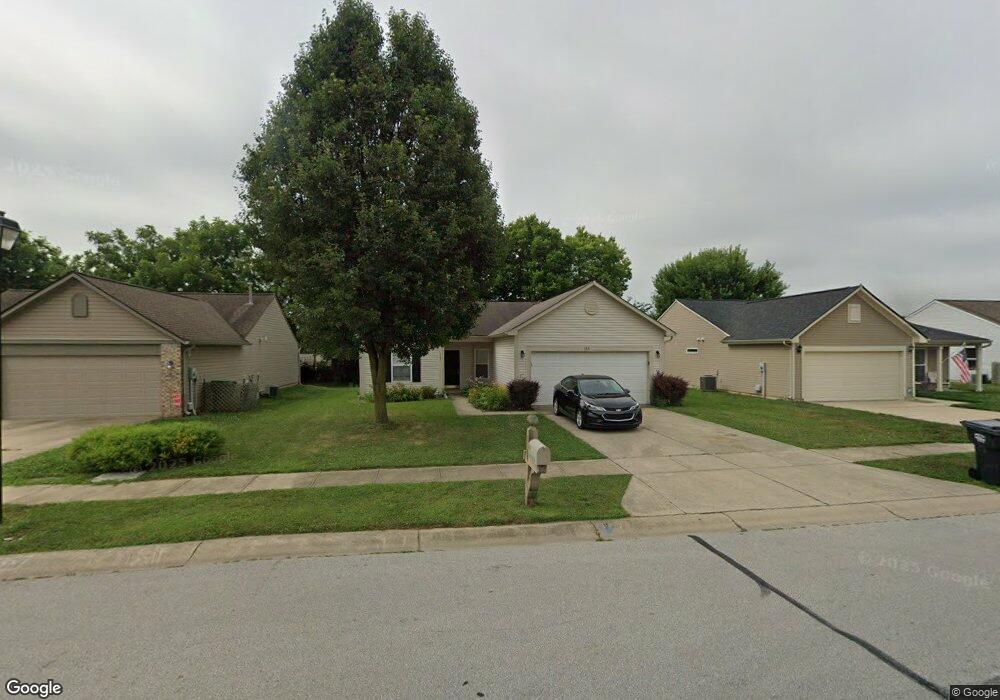
183 Hilltop Farms Blvd Whiteland, IN 46184
Estimated Value: $246,000 - $253,000
3
Beds
2
Baths
1,253
Sq Ft
$199/Sq Ft
Est. Value
About This Home
This home is located at 183 Hilltop Farms Blvd, Whiteland, IN 46184 and is currently estimated at $249,453, approximately $199 per square foot. 183 Hilltop Farms Blvd is a home located in Johnson County with nearby schools including Break-O-Day Elementary School, Clark-Pleasant Middle School, and Whiteland Community High School.
Ownership History
Date
Name
Owned For
Owner Type
Purchase Details
Closed on
Sep 21, 2022
Sold by
Five-Star Investment Group
Bought by
Schuman Llc
Current Estimated Value
Purchase Details
Closed on
Aug 31, 2022
Sold by
Retz Garrett M
Bought by
Five Star Investment Group
Purchase Details
Closed on
Jun 21, 2018
Sold by
Darnall Melody
Bought by
Retz Garrett M and Abbott Kelly
Home Financials for this Owner
Home Financials are based on the most recent Mortgage that was taken out on this home.
Original Mortgage
$139,428
Interest Rate
4.75%
Mortgage Type
FHA
Purchase Details
Closed on
Jun 30, 2006
Sold by
Westport Homes Inc
Bought by
Darnall Melody
Home Financials for this Owner
Home Financials are based on the most recent Mortgage that was taken out on this home.
Original Mortgage
$109,468
Interest Rate
6.72%
Create a Home Valuation Report for This Property
The Home Valuation Report is an in-depth analysis detailing your home's value as well as a comparison with similar homes in the area
Home Values in the Area
Average Home Value in this Area
Purchase History
| Date | Buyer | Sale Price | Title Company |
|---|---|---|---|
| Schuman Llc | $245,000 | Vylla Title | |
| Five Star Investment Group | -- | Janet Davis Hocker Attorney At | |
| Retz Garrett M | -- | Chicago Title | |
| Darnall Melody | -- | None Available |
Source: Public Records
Mortgage History
| Date | Status | Borrower | Loan Amount |
|---|---|---|---|
| Previous Owner | Retz Garrett M | $139,428 | |
| Previous Owner | Darnall Melody | $109,468 |
Source: Public Records
Tax History Compared to Growth
Tax History
| Year | Tax Paid | Tax Assessment Tax Assessment Total Assessment is a certain percentage of the fair market value that is determined by local assessors to be the total taxable value of land and additions on the property. | Land | Improvement |
|---|---|---|---|---|
| 2025 | $4,330 | $212,800 | $56,000 | $156,800 |
| 2024 | $4,330 | $207,300 | $56,000 | $151,300 |
| 2023 | $4,242 | $203,400 | $56,000 | $147,400 |
| 2022 | $1,765 | $170,400 | $29,900 | $140,500 |
| 2021 | $1,510 | $145,600 | $29,900 | $115,700 |
| 2020 | $1,350 | $129,800 | $29,900 | $99,900 |
| 2019 | $1,245 | $120,000 | $29,900 | $90,100 |
| 2018 | $1,163 | $113,000 | $17,200 | $95,800 |
| 2017 | $1,166 | $115,600 | $17,200 | $98,400 |
| 2016 | $1,112 | $111,200 | $17,200 | $94,000 |
| 2014 | $995 | $100,200 | $21,100 | $79,100 |
| 2013 | $995 | $101,000 | $21,100 | $79,900 |
Source: Public Records
Map
Nearby Homes
- 1119 Chateaugay Ct
- 1137 Chateaugay Ct
- 106 Tracy Ridge Blvd
- 190 Tracy Ridge Blvd
- 256 Bittersweet Dr
- 115 Windemere Rd
- 821 Princeton Dr
- 57 Oakden Ct
- 53 Oakden Ct
- 6540 N Us Highway 31
- 731 W 600 N
- 12 Rypma Row
- 250 Southlane Dr
- 1000 Mount Olive Rd
- 551 Greenwood Trace Dr
- 523 Genisis Dr
- 840 Sweetbriar Ave
- 1041 Mount Olive Rd
- 647 Bluestem Cir
- 638 Harvest Meadow Way
- 185 Hilltop Farms Blvd
- 181 Hilltop Farms Blvd
- 179 Hilltop Farms Blvd
- 184 Hilltop Farms Blvd
- 48 Hilltop Farms Blvd
- 177 Hilltop Farms Blvd
- 188 Hilltop Farms Blvd
- 50 Hilltop Farms Blvd
- 175 Hilltop Farms Blvd
- 51 Hilltop Farms Blvd
- 1104 Spend A Buck Ct
- 52 Hilltop Farms Blvd
- 173 Hilltop Farms Blvd
- 53 Hilltop Farms Blvd
- 1110 Spend A Buck Ct
- 6254 N 25 W
- 54 Hilltop Farms Blvd
- 171 Hilltop Farms Blvd
- 1116 Spend A Buck Ct
- 55 Hilltop Farms Blvd