183 Knotty Pine Way Murrells Inlet, SC 29576
Estimated Value: $855,000 - $963,013
3
Beds
4
Baths
2,902
Sq Ft
$317/Sq Ft
Est. Value
About This Home
This home is located at 183 Knotty Pine Way, Murrells Inlet, SC 29576 and is currently estimated at $918,753, approximately $316 per square foot. 183 Knotty Pine Way is a home located in Georgetown County with nearby schools including Waccamaw Elementary School, Waccamaw Intermediate School, and Waccamaw Middle School.
Ownership History
Date
Name
Owned For
Owner Type
Purchase Details
Closed on
Nov 21, 2022
Sold by
Kalat Andrea L
Bought by
Farmer Avis E and Lynch John W
Current Estimated Value
Home Financials for this Owner
Home Financials are based on the most recent Mortgage that was taken out on this home.
Original Mortgage
$647,201
Outstanding Balance
$624,460
Interest Rate
6.94%
Mortgage Type
New Conventional
Estimated Equity
$294,293
Purchase Details
Closed on
Jan 16, 2016
Sold by
Biamonte Jack T and Biamonte Susan E
Bought by
Kalat Edward W and Kalat Andrea L
Purchase Details
Closed on
Oct 14, 2010
Sold by
Branch Banking & Trust Company Of South
Bought by
Biamonte Jack T and Biamonte Susan E
Purchase Details
Closed on
May 21, 2010
Sold by
Muirfield Homes Inc
Bought by
Branch Banking & Trust Company
Purchase Details
Closed on
Aug 17, 2006
Sold by
Prince Creek South Llc
Bought by
Muirfield Homes Inc
Create a Home Valuation Report for This Property
The Home Valuation Report is an in-depth analysis detailing your home's value as well as a comparison with similar homes in the area
Purchase History
| Date | Buyer | Sale Price | Title Company |
|---|---|---|---|
| Farmer Avis E | $826,000 | -- | |
| Kalat Edward W | $69,000 | -- | |
| Biamonte Jack T | $48,000 | -- | |
| Branch Banking & Trust Company | $52,000 | -- | |
| Muirfield Homes Inc | $157,900 | None Available |
Source: Public Records
Mortgage History
| Date | Status | Borrower | Loan Amount |
|---|---|---|---|
| Open | Farmer Avis E | $647,201 |
Source: Public Records
Tax History
| Year | Tax Paid | Tax Assessment Tax Assessment Total Assessment is a certain percentage of the fair market value that is determined by local assessors to be the total taxable value of land and additions on the property. | Land | Improvement |
|---|---|---|---|---|
| 2025 | $4,403 | $35,442 | $6,519 | $28,923 |
| 2024 | $4,403 | $30,820 | $5,000 | $25,820 |
| 2023 | $4,076 | $30,820 | $5,000 | $25,820 |
| 2022 | $2,217 | $20,500 | $3,400 | $17,100 |
| 2021 | $2,146 | $20,504 | $3,400 | $17,104 |
| 2020 | $2,141 | $20,504 | $3,400 | $17,104 |
| 2019 | $1,812 | $17,628 | $3,400 | $14,228 |
| 2018 | $1,858 | $176,280 | $0 | $0 |
| 2017 | $1,270 | $141,200 | $0 | $0 |
| 2016 | $1,075 | $5,100 | $0 | $0 |
| 2015 | -- | $0 | $0 | $0 |
| 2014 | -- | $85,500 | $85,500 | $0 |
| 2012 | -- | $85,500 | $85,500 | $0 |
Source: Public Records
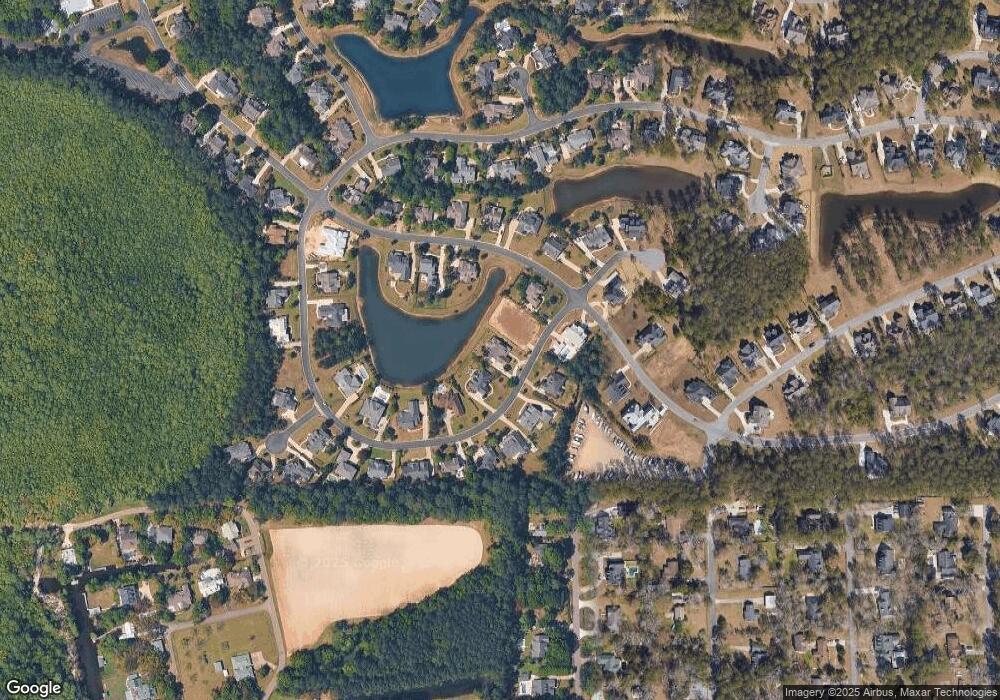
Map
Nearby Homes
- 128 Knotty Pine Way
- 6 Caleb Ct
- 3772 Brown Bark Ln
- 20 Pigeon Forge Ct
- 613 Collins Creek Dr
- 3045 Court St Unit 3045
- 4333 Hunters Wood Dr
- 317 Graytwig Cir Unit ABACO COVE
- 1970 Governors Landing Rd Unit 113
- 1970 Governors Landing Dr Unit 202 C-1
- 3030 Oak Grove Bend Unit 30B
- 123 Hagar Brown Rd Unit Community access to
- 123 Hagar Brown Rd
- 1808 Laurel Trail
- 48 Talon Cir
- 4511 Saint Johns Place
- 19 Pistachio Loop Unit G
- 21 Pistachio Loop Unit F
- 9 Pistachio Loop Unit B
- 9 Pistachio Loop Unit D
- 183 Knotty Pine Way Unit Collins Creek Landin
- 179 Knotty Pine Way
- 187 Knotty Pine Way
- 184 Knotty Pine Way Unit Collins Creek Landin
- 184 Knotty Pine Way
- 173 Knotty Pine Way Unit 176 Knotty Pine Way
- 180 Knotty Pine Way Unit "Lot 174"
- 180 Knotty Pine Way Unit Lot 174 Collins Cree
- 180 Knotty Pine Way
- 191 Knotty Pine Way
- 191 Knotty Pine Way Unit Lot 156
- 171 Knotty Pine Way
- Lot 176 Woody Point Dr
- 172 Knotty Pine Way Unit COLLINS CREEK LANDIN
- 172 Knotty Pine Way
- 176 Woody Point Dr
- 176 Woody Point Dr Unit Lot 176
- Lot 140 Woody Point Dr
- Lot 140 Woody Point Dr Unit Collins Creek Landin
- 561 Woody Point Dr
Your Personal Tour Guide
Ask me questions while you tour the home.