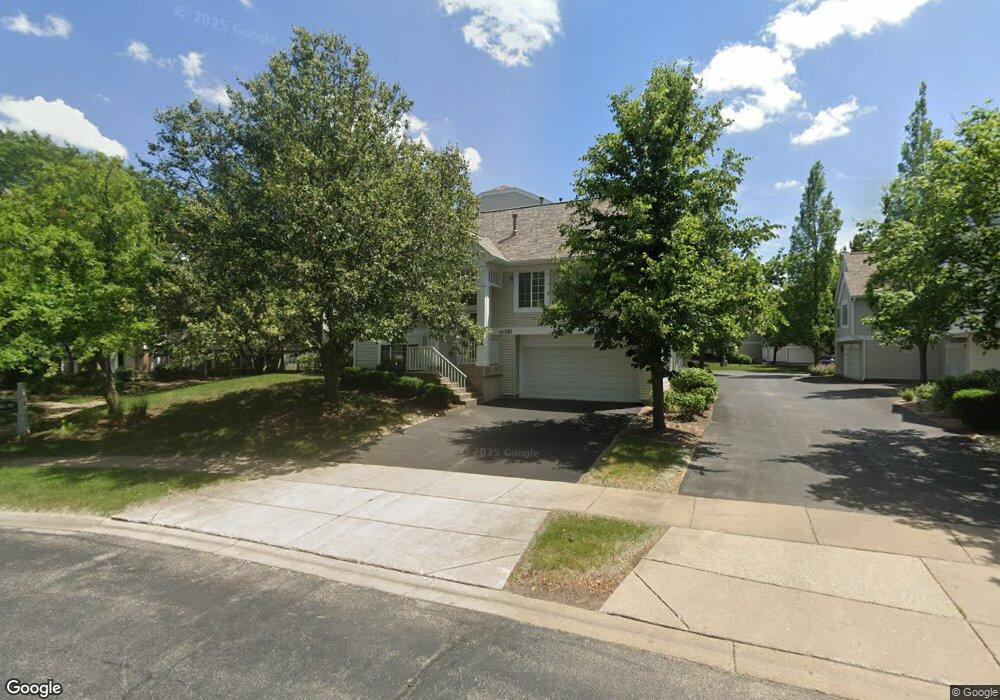
183 Lucerne Ct Unit 103714 Wheeling, IL 60090
Estimated Value: $319,627 - $373,000
3
Beds
--
Bath
240,177
Sq Ft
$1/Sq Ft
Est. Value
About This Home
This home is located at 183 Lucerne Ct Unit 103714, Wheeling, IL 60090 and is currently estimated at $350,407, approximately $1 per square foot. 183 Lucerne Ct Unit 103714 is a home located in Cook County with nearby schools including Frost Elementary School, Oliver W Holmes Middle School, and Wheeling High School.
Ownership History
Date
Name
Owned For
Owner Type
Purchase Details
Closed on
Jun 30, 2005
Sold by
Helfand David A and Helfand Lisa G
Bought by
Mordkhilevich Mikhail I
Current Estimated Value
Home Financials for this Owner
Home Financials are based on the most recent Mortgage that was taken out on this home.
Original Mortgage
$120,000
Outstanding Balance
$34,318
Interest Rate
5.37%
Mortgage Type
Purchase Money Mortgage
Estimated Equity
$316,089
Purchase Details
Closed on
Jul 21, 2000
Sold by
Coelho Boniface and Coelho Jennifer
Bought by
Helfand David A and Helfand Lisa G
Home Financials for this Owner
Home Financials are based on the most recent Mortgage that was taken out on this home.
Original Mortgage
$178,400
Interest Rate
8.16%
Purchase Details
Closed on
Mar 31, 1997
Sold by
Avalon Sienna Llc
Bought by
Coelho Boniface and Coelho Jennifer
Home Financials for this Owner
Home Financials are based on the most recent Mortgage that was taken out on this home.
Original Mortgage
$172,600
Interest Rate
7.75%
Create a Home Valuation Report for This Property
The Home Valuation Report is an in-depth analysis detailing your home's value as well as a comparison with similar homes in the area
Home Values in the Area
Average Home Value in this Area
Purchase History
| Date | Buyer | Sale Price | Title Company |
|---|---|---|---|
| Mordkhilevich Mikhail I | $297,000 | First American | |
| Helfand David A | $223,000 | -- | |
| Coelho Boniface | $182,000 | -- |
Source: Public Records
Mortgage History
| Date | Status | Borrower | Loan Amount |
|---|---|---|---|
| Open | Mordkhilevich Mikhail I | $120,000 | |
| Previous Owner | Helfand David A | $178,400 | |
| Previous Owner | Coelho Boniface | $172,600 |
Source: Public Records
Tax History
| Year | Tax Paid | Tax Assessment Tax Assessment Total Assessment is a certain percentage of the fair market value that is determined by local assessors to be the total taxable value of land and additions on the property. | Land | Improvement |
|---|---|---|---|---|
| 2025 | $6,226 | $30,650 | $5,455 | $25,195 |
| 2024 | $6,226 | $24,422 | $6,294 | $18,128 |
| 2023 | $5,876 | $24,422 | $6,294 | $18,128 |
| 2022 | $5,876 | $24,422 | $6,294 | $18,128 |
| 2021 | $5,707 | $21,288 | $524 | $20,764 |
| 2020 | $5,701 | $21,288 | $524 | $20,764 |
| 2019 | $5,831 | $23,844 | $524 | $23,320 |
| 2018 | $5,314 | $17,906 | $419 | $17,487 |
| 2017 | $5,223 | $17,906 | $419 | $17,487 |
| 2016 | $5,171 | $17,906 | $419 | $17,487 |
| 2015 | $4,737 | $15,831 | $2,412 | $13,419 |
| 2014 | $5,025 | $16,948 | $2,412 | $14,536 |
| 2013 | $4,631 | $16,948 | $2,412 | $14,536 |
Source: Public Records
Map
Nearby Homes
- 42 Cherbourg Ct Unit 492714
- 1450 Sandpebble Dr Unit 333
- 1525 Sander Ct Unit 113
- 15 E Willow Rd
- 1430 Sandstone Dr Unit 202
- 448 Bridle Trail Unit 211
- 523 Bridle Trail Unit 161
- 105 E Elaine Cir
- 103 Coldren Dr
- 1201 Pleasant Run Dr Unit 312
- 802 Andover Ct
- 1033 Wheeling Rd
- 674 Pinecrest Dr Unit 203
- 664 Pinecrest Dr Unit 302
- 988 Ridgefield Ln Unit 54
- 1125 Pleasant Run Dr Unit 807
- 13 W Kenilworth Ave
- 1111 Pleasant Run Dr Unit 911
- 18 E Old Willow Rd Unit 210N
- 18 E Old Willow Rd Unit 535N
- 181 Lucerne Ct Unit 104713
- 185 Lucerne Ct Unit 102714
- 187 Lucerne Ct Unit 101713
- 187 Lucerne Ct Unit 307B
- 163 Lucerne Ct Unit 112714
- 191 Lucerne Ct Unit 91713
- 167 Lucerne Ct Unit 114713
- 197 Lucerne Ct Unit 94713
- 193 Lucerne Ct Unit 92714
- 195 Lucerne Ct Unit 93714
- 1696 Sienna Ct Unit 141714
- 1696 Sienna Ct
- 1694 Sienna Ct Unit 142714
- 1694 Sienna Ct
- 1708 Sienna Ct Unit 155713
- 165 Lucerne Ct Unit 113714
- 1706 Sienna Ct Unit 154714
- 1692 Sienna Ct Unit 143714
- 1704 Sienna Ct Unit 153714
- 157 Lucerne Ct Unit 121713
Your Personal Tour Guide
Ask me questions while you tour the home.