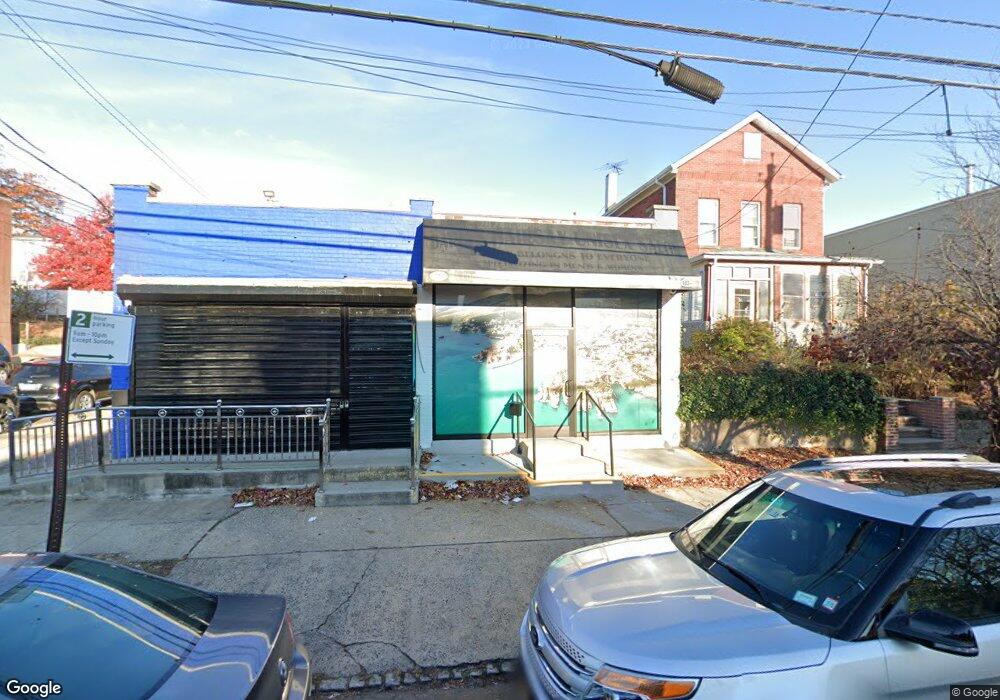
183 Mcclean Ave Unit B Staten Island, NY 10305
South Beach NeighborhoodEstimated Value: $980,156
--
Bed
--
Bath
1,200
Sq Ft
$817/Sq Ft
Est. Value
About This Home
This home is located at 183 Mcclean Ave Unit B, Staten Island, NY 10305 and is currently estimated at $980,156, approximately $816 per square foot. 183 Mcclean Ave Unit B is a home located in Richmond County with nearby schools including P.S. 39 The Francis J. Murphy Jr. School, I.S. 49 Berta A Dreyfus, and Curtis High School.
Ownership History
Date
Name
Owned For
Owner Type
Purchase Details
Closed on
Jul 13, 2018
Sold by
Manzi Nicholas F
Bought by
Mandia Marie and 2018 Manzi Family Trust
Current Estimated Value
Purchase Details
Closed on
Jun 22, 2017
Sold by
Mandia Marie
Bought by
Mandia Marie
Purchase Details
Closed on
Apr 24, 2000
Sold by
Manzi Salvatore and Manzi Helen
Bought by
Manzi Nicholas F and Mandia Marie
Create a Home Valuation Report for This Property
The Home Valuation Report is an in-depth analysis detailing your home's value as well as a comparison with similar homes in the area
Home Values in the Area
Average Home Value in this Area
Purchase History
| Date | Buyer | Sale Price | Title Company |
|---|---|---|---|
| Mandia Marie | -- | None Available | |
| Mandia Marie | -- | Titlevest Agency Inc | |
| Manzi Nicholas F | -- | Fidelity National Title Ins |
Source: Public Records
Tax History Compared to Growth
Tax History
| Year | Tax Paid | Tax Assessment Tax Assessment Total Assessment is a certain percentage of the fair market value that is determined by local assessors to be the total taxable value of land and additions on the property. | Land | Improvement |
|---|---|---|---|---|
| 2025 | $26,187 | $200,700 | $108,039 | $92,661 |
| 2024 | $26,187 | $209,700 | $95,743 | $113,957 |
| 2023 | $23,792 | $193,950 | $97,718 | $96,232 |
| 2022 | $23,113 | $225,000 | $95,850 | $129,150 |
| 2021 | $21,457 | $248,895 | $87,750 | $161,145 |
| 2020 | $21,817 | $241,650 | $87,750 | $153,900 |
| 2019 | $20,718 | $201,420 | $87,750 | $113,670 |
| 2018 | $19,346 | $152,100 | $79,516 | $72,584 |
| 2017 | $9,116 | $145,314 | $80,961 | $64,353 |
| 2016 | $17,346 | $134,550 | $82,507 | $52,043 |
| 2015 | $16,610 | $134,550 | $74,750 | $59,800 |
| 2014 | $16,610 | $126,360 | $78,975 | $47,385 |
Source: Public Records
Map
Nearby Homes
- 26 Conger St
- 146 Cedar Ave
- 27 Conger St
- 10 Florida Ave
- 154 Sand Ln
- 72 Sand Ln
- 53 Piave Ave
- 233 Sand Ln
- 71 Windom Ave
- 26 Guilford St
- 14 Ragazzi Ln
- 26 Robin Rd
- 799 Hylan Blvd
- 147 Robin Rd
- 603 W Fingerboard Rd
- 21 Father Capodanno Blvd
- 19 Father Capodanno Blvd
- 32 Linda Ave Unit 68
- 785 Hylan Blvd
- 150 Linwood Ave
- 183 Mcclean Ave Unit A
- 183 Mcclean Ave
- 181 Mcclean Ave
- 181-183 Mcclean Ave
- 179 Mcclean Ave Unit 2
- 179 Mcclean Ave Unit 1
- 179 Mcclean Ave
- 91 Wallace Ave
- 187 Mcclean Ave
- 182 Mcclean Ave
- 175 Mcclean Ave
- 180 Mcclean Ave
- 191 Mcclean Ave
- 44 Macfarland Ave
- 95 Wallace Ave Unit Basement
- 95 Wallace Ave
- 48 Macfarland Ave Unit 1
- 48 Macfarland Ave
- 178 Mcclean Ave
- 40 Macfarland Ave