T
Seller's Agent in 2024
Tom Havrillia
Demand Realty
(504) 577-7779
5 Total Sales


Estimated Value: $167,000 - $251,000
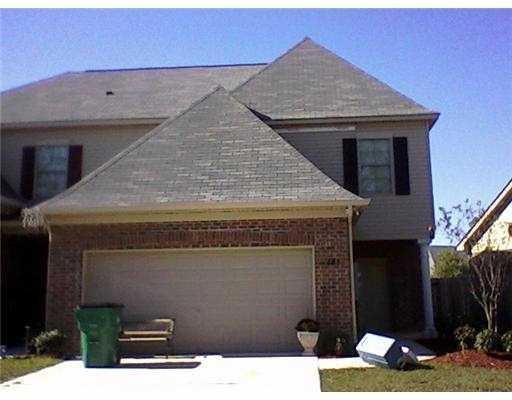
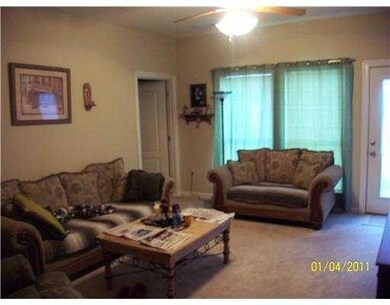
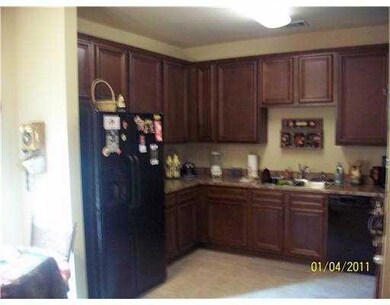
VERY SPACIOUS 3 BEDROOM, 2 & 1/2 BATH CONDO FOR LEASE FEATURING A 2 CAR GARAGE AND FENCED BACK YARD. GREAT LOCATION OFF GAUSE ACCESIBLE TO RESTAURANTS AND SHOPPING. MINUTES FROM I-10 WITH QUICK ACCESS TO COVINGTON OR NEW ORLEANS. SMALL PETS ON A CASE-BY-CASE BASIS.
| Date | Event | Price | List to Sale | Price per Sq Ft | Prior Sale |
|---|---|---|---|---|---|
| 11/20/2024 11/20/24 | Rented | $1,850 | 0.0% | -- | |
| 10/30/2024 10/30/24 | For Rent | $1,850 | +32.6% | -- | |
| 03/15/2017 03/15/17 | Rented | $1,395 | 0.0% | -- | |
| 02/13/2017 02/13/17 | Under Contract | -- | -- | -- | |
| 01/18/2017 01/18/17 | For Rent | $1,395 | 0.0% | -- | |
| 12/30/2015 12/30/15 | For Rent | $1,395 | +7.3% | -- | |
| 12/30/2015 12/30/15 | Rented | $1,300 | 0.0% | -- | |
| 07/11/2012 07/11/12 | For Rent | $1,300 | 0.0% | -- | |
| 07/11/2012 07/11/12 | Rented | $1,300 | 0.0% | -- | |
| 06/29/2012 06/29/12 | Sold | -- | -- | -- | View Prior Sale |
| 05/30/2012 05/30/12 | Pending | -- | -- | -- | |
| 03/15/2012 03/15/12 | For Sale | $129,000 | -- | $82 / Sq Ft |
| Year | Tax Paid | Tax Assessment Tax Assessment Total Assessment is a certain percentage of the fair market value that is determined by local assessors to be the total taxable value of land and additions on the property. | Land | Improvement |
|---|---|---|---|---|
| 2025 | $2,336 | $15,878 | $1,500 | $14,378 |
| 2024 | $2,336 | $15,878 | $1,500 | $14,378 |
| 2023 | $2,490 | $13,530 | $1,500 | $12,030 |
| 2022 | $229,053 | $13,530 | $1,500 | $12,030 |
| 2021 | $2,289 | $13,530 | $1,500 | $12,030 |
| 2020 | $2,279 | $13,530 | $1,500 | $12,030 |
| 2019 | $1,993 | $11,372 | $1,500 | $9,872 |
| 2018 | $1,998 | $11,372 | $1,500 | $9,872 |
| 2017 | $2,010 | $11,372 | $1,500 | $9,872 |
| 2016 | $2,056 | $11,372 | $1,500 | $9,872 |
| 2015 | $2,104 | $11,688 | $1,500 | $10,188 |
| 2014 | $2,107 | $11,688 | $1,500 | $10,188 |
| 2013 | -- | $11,688 | $1,500 | $10,188 |
T
Seller's Agent in 2024
Tom Havrillia
Demand Realty
(504) 577-7779
5 Total Sales
A
Buyer's Agent in 2016
Amee Schultz
Berkshire Hathaway HomeServices Preferred, REALTOR

Landlord's Agent in 2012
Liz Ashe
Demand Realty
(504) 401-4285
20 in this area
189 Total Sales
Tenant's Agent in 2012
Aimee Ashe
Demand Realty
(504) 319-0443
14 in this area
162 Total Sales
Source: ROAM MLS
MLS Number: 920849
APN: 85920
Ask me questions while you tour the home.