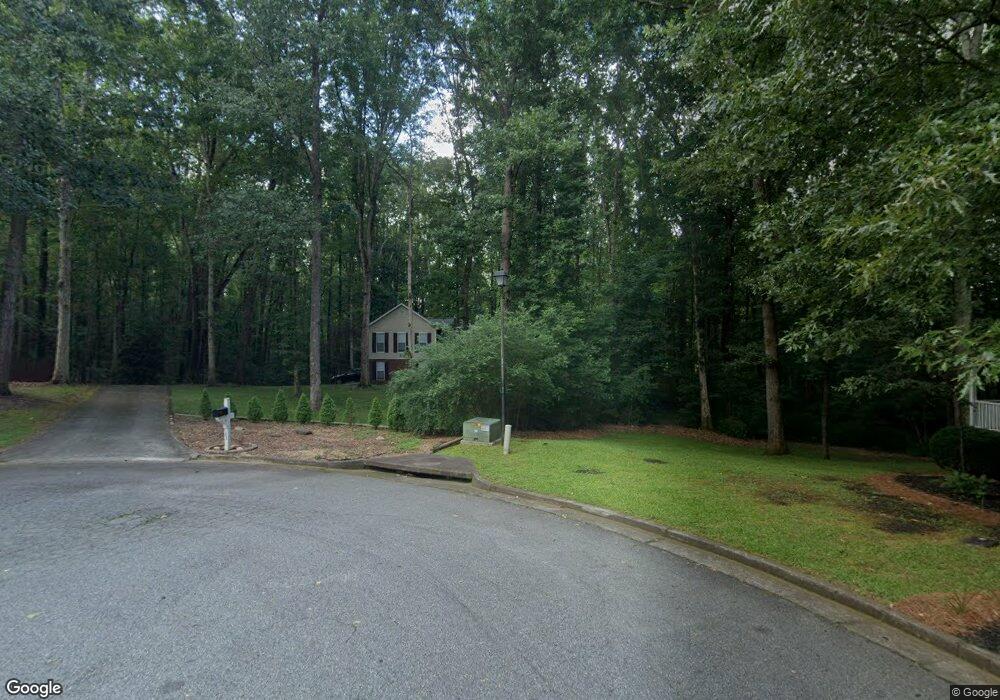
183 Regency Dr Unit 28 Bethlehem, GA 30620
Estimated Value: $304,018 - $332,000
3
Beds
3
Baths
1,436
Sq Ft
$221/Sq Ft
Est. Value
About This Home
This home is located at 183 Regency Dr Unit 28, Bethlehem, GA 30620 and is currently estimated at $317,255, approximately $220 per square foot. 183 Regency Dr Unit 28 is a home located in Barrow County with nearby schools including Bethlehem Elementary School, Haymon-Morris Middle School, and Apalachee High School.
Ownership History
Date
Name
Owned For
Owner Type
Purchase Details
Closed on
Apr 3, 2020
Sold by
Bresky Kevin J
Bought by
Bruneau Thomas
Current Estimated Value
Home Financials for this Owner
Home Financials are based on the most recent Mortgage that was taken out on this home.
Original Mortgage
$162,800
Outstanding Balance
$142,705
Interest Rate
3.2%
Mortgage Type
New Conventional
Estimated Equity
$174,550
Purchase Details
Closed on
Jun 1, 2018
Sold by
Rac Properties Of Athens Inc
Bought by
Bresky Kevin J
Home Financials for this Owner
Home Financials are based on the most recent Mortgage that was taken out on this home.
Original Mortgage
$163,400
Interest Rate
4.5%
Mortgage Type
New Conventional
Purchase Details
Closed on
Mar 8, 2018
Sold by
Tillman Terri Lynne
Bought by
Rac Properties Of Athens Inc
Purchase Details
Closed on
Feb 27, 1997
Sold by
North Star Custom Ho
Bought by
Tillman Terri Lynne
Purchase Details
Closed on
Sep 6, 1996
Sold by
Developme Dun La Hur
Bought by
North Star Custom Ho
Purchase Details
Closed on
Mar 8, 1996
Bought by
Developme Dun La Hur
Create a Home Valuation Report for This Property
The Home Valuation Report is an in-depth analysis detailing your home's value as well as a comparison with similar homes in the area
Home Values in the Area
Average Home Value in this Area
Purchase History
| Date | Buyer | Sale Price | Title Company |
|---|---|---|---|
| Bruneau Thomas | $203,500 | -- | |
| Bruneau Thomas | $203,500 | -- | |
| Bresky Kevin J | $172,000 | -- | |
| Bresky Kevin J | -- | -- | |
| Bresky Kevin J | $172,000 | -- | |
| Bresky Kevin J | -- | -- | |
| Rac Properties Of Athens Inc | $65,800 | -- | |
| Rac Properties Of Athens Inc | $65,800 | -- | |
| Tillman Terri Lynne | $107,400 | -- | |
| Tillman Terri Lynne | $107,400 | -- | |
| North Star Custom Ho | $48,000 | -- | |
| North Star Custom Ho | $48,000 | -- | |
| Developme Dun La Hur | -- | -- | |
| Developme Dun La Hur | -- | -- |
Source: Public Records
Mortgage History
| Date | Status | Borrower | Loan Amount |
|---|---|---|---|
| Open | Bruneau Thomas | $162,800 | |
| Previous Owner | Bresky Kevin J | $163,400 |
Source: Public Records
Tax History
| Year | Tax Paid | Tax Assessment Tax Assessment Total Assessment is a certain percentage of the fair market value that is determined by local assessors to be the total taxable value of land and additions on the property. | Land | Improvement |
|---|---|---|---|---|
| 2025 | $1,364 | $113,244 | $25,000 | $88,244 |
| 2024 | $1,339 | $107,193 | $25,000 | $82,193 |
| 2023 | $947 | $107,593 | $25,000 | $82,593 |
| 2022 | $2,529 | $86,854 | $20,000 | $66,854 |
| 2021 | $2,122 | $68,318 | $16,000 | $52,318 |
| 2020 | $2,126 | $68,318 | $16,000 | $52,318 |
| 2019 | $2,164 | $68,318 | $16,000 | $52,318 |
| 2018 | $1,552 | $48,850 | $12,600 | $36,250 |
| 2017 | $1,183 | $40,618 | $12,600 | $28,018 |
| 2016 | $1,299 | $40,954 | $12,600 | $28,354 |
| 2015 | $1,326 | $41,628 | $12,600 | $29,028 |
| 2014 | $1,178 | $35,539 | $6,174 | $29,365 |
| 2013 | -- | $34,137 | $6,174 | $27,963 |
Source: Public Records
Map
Nearby Homes
- 1408 Wyndham Way
- 82 McElhannon Rd SE
- 534 Walton Dr
- 127 Tanners Bridge Rd
- 396 Tanners Bridge Rd
- 400 Tanners Bridge Rd
- 463 Tanners Bridge Rd Unit 2
- 1217 Cabin Bridge Rd
- 1050 Bethlehem Church Rd
- 2470 Shoal Creek Rd
- 812 Christmas Ave
- 222 Lynn Rd
- 784 Manger Ave
- 1701 Trotters Ct
- 1224 Dale Dr
- 465 Cade Ct
- 0 Manger Ave E Unit 20154677
- 0 Manger Ave E Unit 20127001
- 53 Rowlett Place
- 54 Rowlett Place
- 183 Regency Dr
- 181 Regency Dr
- 1426 Wyndham Way
- 1426 Wyndham Way Unit 37
- 178 Regency Dr
- 1422 Wyndham Way
- 179 Regency Dr
- 1427 Wyndham Way
- 176 Regency Dr
- 1420 Wyndham Way
- 171 Regency Dr
- 1425 Wyndham Way Unit na
- 1425 Wyndham Way
- 174 Regency Dr
- 1406 Wyndham Way
- 172 Regency Dr
- 1408 Wyndham Way Unit 34
- 1402 Wyndham Way
- 170 Regency Dr
- 1415 Wyndham Way