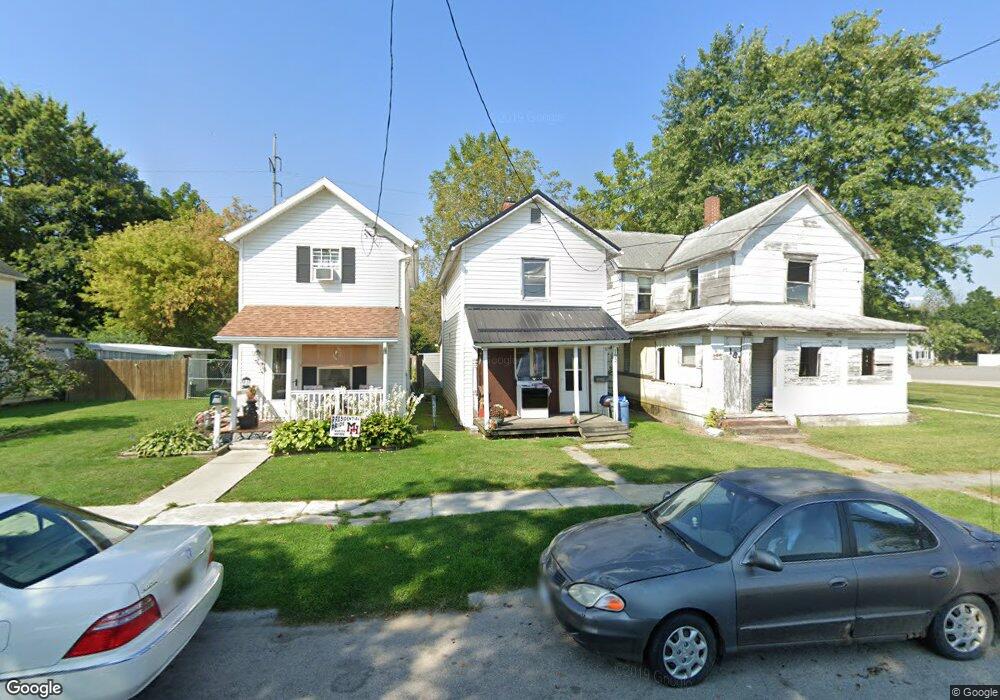
183 Sharp St Marion, OH 43302
Estimated Value: $76,779 - $94,000
2
Beds
1
Bath
1,024
Sq Ft
$83/Sq Ft
Est. Value
About This Home
This home is located at 183 Sharp St, Marion, OH 43302 and is currently estimated at $85,445, approximately $83 per square foot. 183 Sharp St is a home located in Marion County with nearby schools including James A. Garfield Elementary School, Ulysses S. Grant Middle School, and Harding High School.
Ownership History
Date
Name
Owned For
Owner Type
Purchase Details
Closed on
Apr 5, 2023
Sold by
Williams Raymond A
Bought by
Williams Raymond A
Current Estimated Value
Purchase Details
Closed on
Nov 29, 2018
Sold by
White Keith A
Bought by
Williams Raymond A
Purchase Details
Closed on
Mar 17, 2017
Sold by
Hutchinson Jeremiah S
Bought by
White Keith A
Purchase Details
Closed on
Jul 29, 2015
Sold by
Ramey Ronald and Honaker Mandy
Bought by
Hutchinson Jeremiah S
Purchase Details
Closed on
Feb 9, 2012
Sold by
Lamb Calvin T
Bought by
Ramey Ronald and Honaker Mandy
Purchase Details
Closed on
Apr 16, 2003
Bought by
Hutchinson Jeremiah S
Purchase Details
Closed on
Jan 31, 2003
Bought by
Hutchinson Jeremiah S
Purchase Details
Closed on
May 31, 2001
Bought by
Hutchinson Jeremiah S
Purchase Details
Closed on
Oct 24, 1997
Bought by
Hutchinson Jeremiah S
Purchase Details
Closed on
Oct 7, 1996
Bought by
Hutchinson Jeremiah S
Create a Home Valuation Report for This Property
The Home Valuation Report is an in-depth analysis detailing your home's value as well as a comparison with similar homes in the area
Home Values in the Area
Average Home Value in this Area
Purchase History
| Date | Buyer | Sale Price | Title Company |
|---|---|---|---|
| Williams Raymond A | $77,750 | None Listed On Document | |
| Williams Raymond A | $3,000 | None Available | |
| White Keith A | $3,500 | None Available | |
| Hutchinson Jeremiah S | $4,900 | Attorney | |
| Ramey Ronald | $19,000 | None Available | |
| Hutchinson Jeremiah S | $14,000 | -- | |
| Hutchinson Jeremiah S | $25,000 | -- | |
| Hutchinson Jeremiah S | $16,000 | -- | |
| Hutchinson Jeremiah S | -- | -- | |
| Hutchinson Jeremiah S | $9,000 | -- | |
| Hutchinson Jeremiah S | $10,000 | -- |
Source: Public Records
Tax History
| Year | Tax Paid | Tax Assessment Tax Assessment Total Assessment is a certain percentage of the fair market value that is determined by local assessors to be the total taxable value of land and additions on the property. | Land | Improvement |
|---|---|---|---|---|
| 2025 | $697 | $22,050 | $2,890 | $19,160 |
| 2024 | $697 | $18,140 | $2,800 | $15,340 |
| 2023 | $697 | $11,430 | $2,800 | $8,630 |
| 2022 | $631 | $9,580 | $950 | $8,630 |
| 2021 | $376 | $9,460 | $830 | $8,630 |
| 2020 | $377 | $9,460 | $830 | $8,630 |
| 2019 | $366 | $9,460 | $830 | $8,630 |
| 2018 | $493 | $8,040 | $830 | $7,210 |
| 2017 | $324 | $8,040 | $830 | $7,210 |
| 2016 | $321 | $8,040 | $830 | $7,210 |
| 2015 | $312 | $7,860 | $790 | $7,070 |
| 2014 | $502 | $7,860 | $790 | $7,070 |
| 2012 | $228 | $5,530 | $890 | $4,640 |
Source: Public Records
Map
Nearby Homes
Your Personal Tour Guide
Ask me questions while you tour the home.