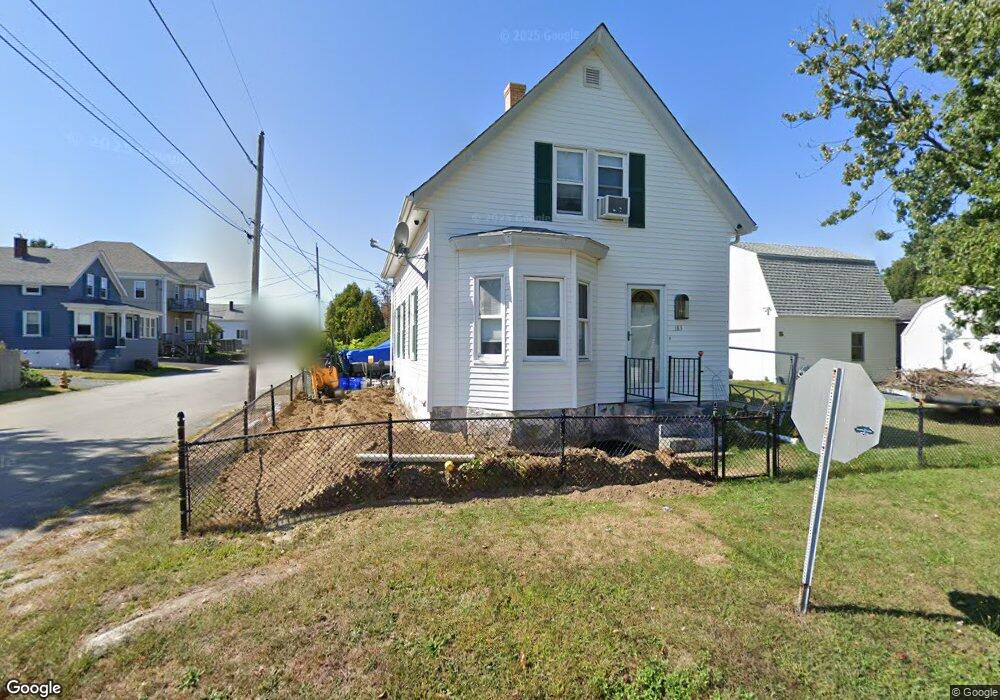
183 Shove St Tiverton, RI 02878
North Tiverton NeighborhoodEstimated Value: $331,000 - $408,000
2
Beds
1
Bath
865
Sq Ft
$440/Sq Ft
Est. Value
About This Home
This home is located at 183 Shove St, Tiverton, RI 02878 and is currently estimated at $380,320, approximately $439 per square foot. 183 Shove St is a home located in Newport County with nearby schools including Tiverton High School, Holy Trinity School, and Saint Stanislaus School.
Ownership History
Date
Name
Owned For
Owner Type
Purchase Details
Closed on
Oct 26, 1999
Sold by
Pedder Jason D and Pedder Stacy
Bought by
Lopes Dawn F and Cabral Jose L
Current Estimated Value
Purchase Details
Closed on
Nov 14, 1995
Sold by
Pedder Douglas M and Pedder Marie
Bought by
Pedder Jason D and Vieira Stacy L
Create a Home Valuation Report for This Property
The Home Valuation Report is an in-depth analysis detailing your home's value as well as a comparison with similar homes in the area
Home Values in the Area
Average Home Value in this Area
Purchase History
| Date | Buyer | Sale Price | Title Company |
|---|---|---|---|
| Lopes Dawn F | $119,000 | -- | |
| Pedder Jason D | $115,000 | -- |
Source: Public Records
Mortgage History
| Date | Status | Borrower | Loan Amount |
|---|---|---|---|
| Closed | Pedder Jason D | $68,000 | |
| Closed | Pedder Jason D | $105,000 | |
| Closed | Pedder Jason D | $50,000 |
Source: Public Records
Tax History Compared to Growth
Tax History
| Year | Tax Paid | Tax Assessment Tax Assessment Total Assessment is a certain percentage of the fair market value that is determined by local assessors to be the total taxable value of land and additions on the property. | Land | Improvement |
|---|---|---|---|---|
| 2025 | $3,287 | $297,500 | $89,100 | $208,400 |
| 2024 | $3,287 | $297,500 | $89,100 | $208,400 |
| 2023 | $3,397 | $228,000 | $86,700 | $141,300 |
| 2022 | $3,336 | $228,000 | $86,700 | $141,300 |
| 2021 | $3,254 | $228,000 | $86,700 | $141,300 |
| 2020 | $2,937 | $181,400 | $61,900 | $119,500 |
| 2019 | $2,864 | $181,400 | $61,900 | $119,500 |
| 2018 | $2,973 | $181,400 | $61,900 | $119,500 |
| 2017 | $3,019 | $158,500 | $61,900 | $96,600 |
| 2016 | $3,034 | $158,500 | $61,900 | $96,600 |
| 2015 | $3,034 | $158,500 | $61,900 | $96,600 |
| 2014 | $2,986 | $154,700 | $61,900 | $92,800 |
Source: Public Records
Map
Nearby Homes
- 238 Judson St
- 495 Hooper St
- 153 Fish Rd Unit 4
- 0 Kaufman Rd Unit 73333701
- 0 Kaufman Rd Unit 1384670
- 88 Kenyon Rd
- 64 Kenyon Rd
- 17 Lynwood St
- 81 Kenyon Rd
- 345 Main Rd Unit 204
- 105 Borden Rd
- 78 Kaufman Rd
- 12 Horizon Dr
- 8 Bronson St
- 12 Bronson St
- 16 Bronson St
- 579 Summit St Unit 3
- 579 Summit St Unit 2
- 20 Bronson St
- 24 Bronson St