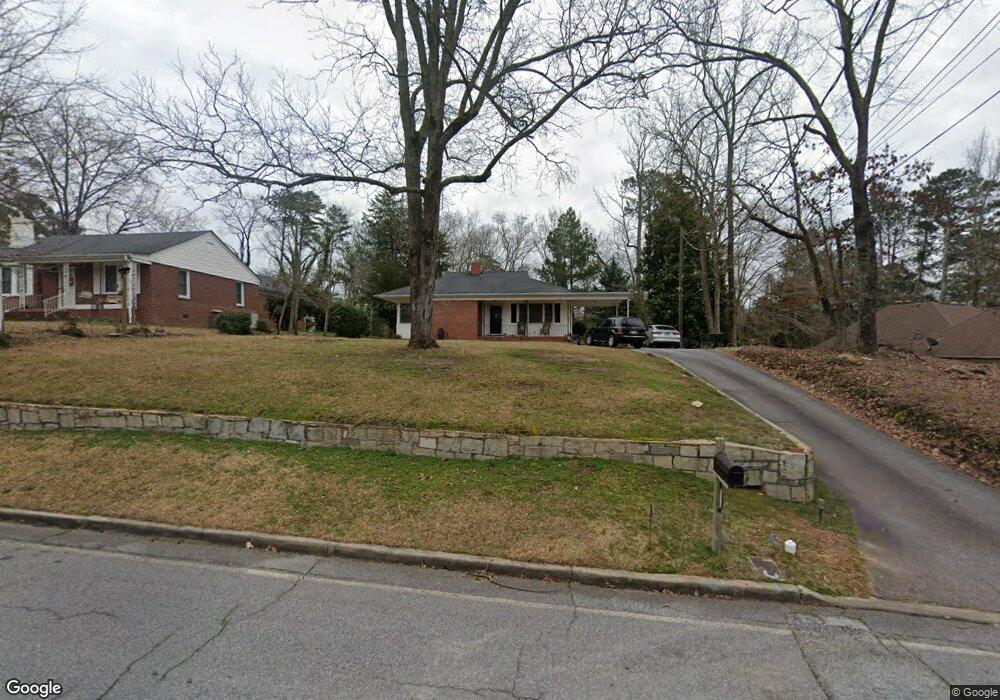
183 Springdale Rd Elberton, GA 30635
Estimated Value: $140,954 - $190,000
--
Bed
1
Bath
1,300
Sq Ft
$131/Sq Ft
Est. Value
About This Home
This home is located at 183 Springdale Rd, Elberton, GA 30635 and is currently estimated at $170,239, approximately $130 per square foot. 183 Springdale Rd is a home located in Elbert County with nearby schools including Elbert County Primary School, Elbert County Elementary School, and Elbert County Middle School.
Ownership History
Date
Name
Owned For
Owner Type
Purchase Details
Closed on
Dec 10, 2015
Sold by
Farmer Robert W
Bought by
Cartledge Caleb M
Current Estimated Value
Home Financials for this Owner
Home Financials are based on the most recent Mortgage that was taken out on this home.
Original Mortgage
$45,000
Outstanding Balance
$16,409
Interest Rate
4.01%
Estimated Equity
$153,830
Purchase Details
Closed on
Jul 30, 2010
Sold by
Farmer James Herndon
Bought by
Farmer Robert W
Purchase Details
Closed on
Dec 11, 2009
Sold by
Farmer Robert W
Bought by
Farmer James Herndon
Home Financials for this Owner
Home Financials are based on the most recent Mortgage that was taken out on this home.
Original Mortgage
$51,200
Interest Rate
4.92%
Purchase Details
Closed on
Feb 15, 1950
Sold by
Galli P E
Bought by
Farmer Robert W
Create a Home Valuation Report for This Property
The Home Valuation Report is an in-depth analysis detailing your home's value as well as a comparison with similar homes in the area
Home Values in the Area
Average Home Value in this Area
Purchase History
| Date | Buyer | Sale Price | Title Company |
|---|---|---|---|
| Cartledge Caleb M | $50,000 | -- | |
| Farmer Robert W | $22,328 | -- | |
| Farmer James Herndon | $51,200 | -- | |
| Farmer Robert W | $800 | -- |
Source: Public Records
Mortgage History
| Date | Status | Borrower | Loan Amount |
|---|---|---|---|
| Open | Cartledge Caleb M | $45,000 | |
| Previous Owner | Farmer James Herndon | $51,200 |
Source: Public Records
Tax History Compared to Growth
Tax History
| Year | Tax Paid | Tax Assessment Tax Assessment Total Assessment is a certain percentage of the fair market value that is determined by local assessors to be the total taxable value of land and additions on the property. | Land | Improvement |
|---|---|---|---|---|
| 2024 | $1,310 | $55,244 | $6,972 | $48,272 |
| 2023 | $1,310 | $55,244 | $6,972 | $48,272 |
| 2022 | $967 | $41,318 | $6,972 | $34,346 |
| 2021 | $975 | $41,318 | $6,972 | $34,346 |
| 2020 | $821 | $31,752 | $6,972 | $24,780 |
| 2019 | $847 | $31,752 | $6,972 | $24,780 |
| 2018 | $866 | $31,752 | $6,972 | $24,780 |
| 2017 | $868 | $29,622 | $6,972 | $22,650 |
| 2016 | $587 | $29,622 | $6,972 | $22,650 |
| 2015 | -- | $29,622 | $6,972 | $22,650 |
| 2014 | -- | $29,622 | $6,972 | $22,650 |
| 2013 | -- | $29,468 | $6,972 | $22,496 |
Source: Public Records
Map
Nearby Homes
- 173 Brookside Dr
- 181 Brookside Dr
- 135 Brookside Dr
- 252 Edwards St
- 245 Edwards St
- 120 S Tusten St
- 141 Wildwood Dr
- 105 S Thomas St
- 844 Sherwood Dr
- 214 Campbell St
- 196 S Oliver St
- 2790 Cedar Creek Rd
- 968 Ext Elbert St
- 415 Athenia St
- 211 Snyder Ave
- 0 Oak Dr Unit 7643600
- 0 Oak Dr Unit 10598083
- 62 Oak St
- 118 Oak Dr
- 108 Brookhaven Cir
- 181 Springdale Rd
- 185 Springdale Rd
- 175 Springdale Rd
- 175 Springdale Rd Unit 48
- 127 Heard Dr
- 170 Brookside Dr
- 168 Springdale Rd
- 170 Springdale Rd
- 166 Springdale Rd
- 172 Brookside Dr
- 169 Springdale Rd
- 174 Springdale Rd
- 162 Springdale Rd
- 0 Springdale Rd Unit CM917387
- 0 Springdale Rd Unit 8135050
- 0 Springdale Rd Unit 7642214
- 0 Springdale Rd Unit 7265945
- 0 Springdale Rd Unit 3276296
- 0 Springdale Rd Unit 8923544
- 0 Springdale Rd Unit 9046850