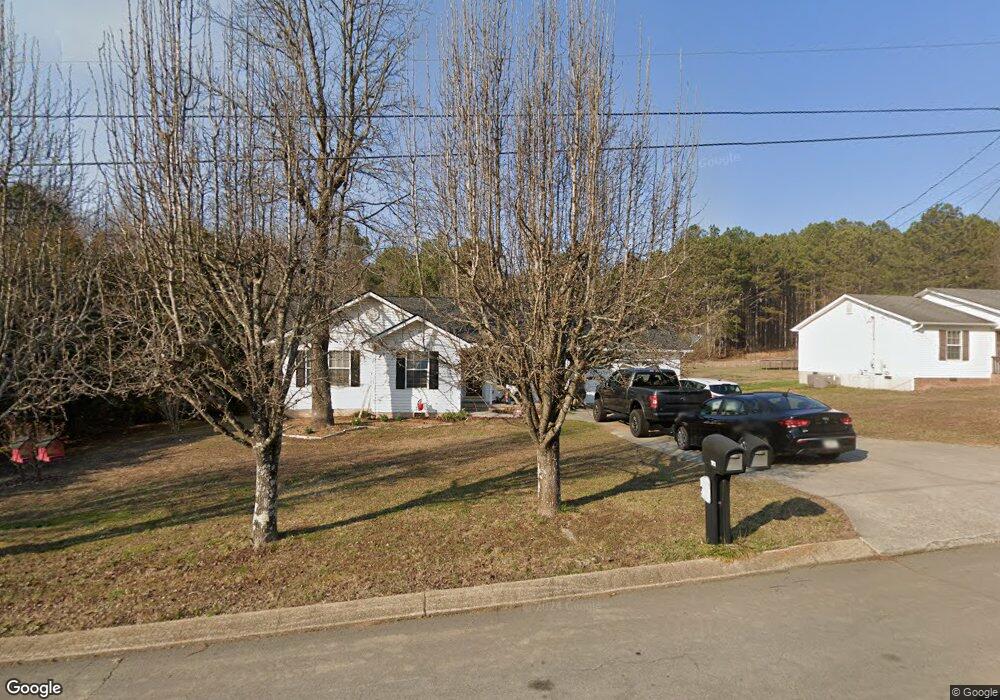
183 Timberland Trail Unit 9 Ringgold, GA 30736
Keith NeighborhoodEstimated Value: $232,000 - $259,045
--
Bed
2
Baths
1,100
Sq Ft
$225/Sq Ft
Est. Value
About This Home
This home is located at 183 Timberland Trail Unit 9, Ringgold, GA 30736 and is currently estimated at $247,511, approximately $225 per square foot. 183 Timberland Trail Unit 9 is a home located in Catoosa County with nearby schools including Tiger Creek Elementary School, Ringgold Middle School, and Ringgold High School.
Ownership History
Date
Name
Owned For
Owner Type
Purchase Details
Closed on
Sep 9, 2021
Sold by
Clemons Stacey
Bought by
Clemons Stacey L and Clemons Jennifer S
Current Estimated Value
Purchase Details
Closed on
Jun 5, 2015
Sold by
Federal National Mortgage Association
Bought by
Clemons Stacey
Home Financials for this Owner
Home Financials are based on the most recent Mortgage that was taken out on this home.
Original Mortgage
$90,333
Interest Rate
3.88%
Mortgage Type
FHA
Purchase Details
Closed on
Sep 2, 2014
Sold by
Green Michael L
Bought by
Federal National Mtg Associati
Purchase Details
Closed on
Jul 28, 2006
Sold by
Not Provided
Bought by
Green Michael L
Home Financials for this Owner
Home Financials are based on the most recent Mortgage that was taken out on this home.
Original Mortgage
$116,600
Interest Rate
6.74%
Mortgage Type
New Conventional
Create a Home Valuation Report for This Property
The Home Valuation Report is an in-depth analysis detailing your home's value as well as a comparison with similar homes in the area
Home Values in the Area
Average Home Value in this Area
Purchase History
| Date | Buyer | Sale Price | Title Company |
|---|---|---|---|
| Clemons Stacey L | -- | -- | |
| Clemons Stacey | -- | -- | |
| Federal National Mtg Associati | -- | -- | |
| Green Michael L | $116,600 | -- |
Source: Public Records
Mortgage History
| Date | Status | Borrower | Loan Amount |
|---|---|---|---|
| Previous Owner | Clemons Stacey | $90,333 | |
| Previous Owner | Green Michael L | $116,600 |
Source: Public Records
Tax History Compared to Growth
Tax History
| Year | Tax Paid | Tax Assessment Tax Assessment Total Assessment is a certain percentage of the fair market value that is determined by local assessors to be the total taxable value of land and additions on the property. | Land | Improvement |
|---|---|---|---|---|
| 2024 | $1,817 | $87,204 | $12,000 | $75,204 |
| 2023 | $1,501 | $69,024 | $12,000 | $57,024 |
| 2022 | $1,150 | $53,364 | $12,000 | $41,364 |
| 2021 | $1,075 | $53,364 | $12,000 | $41,364 |
| 2020 | $1,066 | $46,080 | $10,000 | $36,080 |
| 2019 | $1,031 | $46,080 | $10,000 | $36,080 |
| 2018 | $1,138 | $46,080 | $10,000 | $36,080 |
| 2017 | $1,015 | $43,100 | $8,000 | $35,100 |
| 2016 | $939 | $40,542 | $8,000 | $32,542 |
| 2015 | -- | $37,681 | $8,000 | $29,681 |
| 2014 | -- | $40,287 | $8,000 | $32,287 |
| 2013 | -- | $40,286 | $8,000 | $32,286 |
Source: Public Records
Map
Nearby Homes
- 4348 Keith Rd
- 4440 Keith Rd
- 416 Timberland Trail
- 141 Promise Heights Dr
- 1023 Keith Salem Rd
- 9 Stonegate Place
- 5742 Keith Rd
- 56 Righteous Ln
- 58 Old Cohutta Rd
- 3969 Salem Valley Rd
- 1025 Lowe Rd
- 0 Old Tunnel Hill Rd
- 479 Cooper Rd
- 0 Friendship Rd
- 0 Cooper Rd Unit 131107
- 230 Appaloosa Dr
- 4950 Standifer Rd
- 1412 Keith Rd
- 352 Saddle Horse Cir
- 4978 Standifer Rd
- 183 Timberland Trail
- 183 Timberland Trail
- 201 Timberland Trail
- 218 Timberland Trail
- 159 Timberland Trail
- 184 Timberland Trail
- 166 Timberland Trail
- 219 Timberland Trail
- 204 Timberland Trail
- 204 Timberland Tr
- 137 Timberland Trail
- 302 Timberland Trail
- 146 Timberland Trail
- 222 Timberland Trail
- 126 Timberland Trail
- 239 Timberland Trail
- 242 Timberland Trail
- 106 Timberland Trail
- 106 Timberland Trail
- 261 Timberland Trail