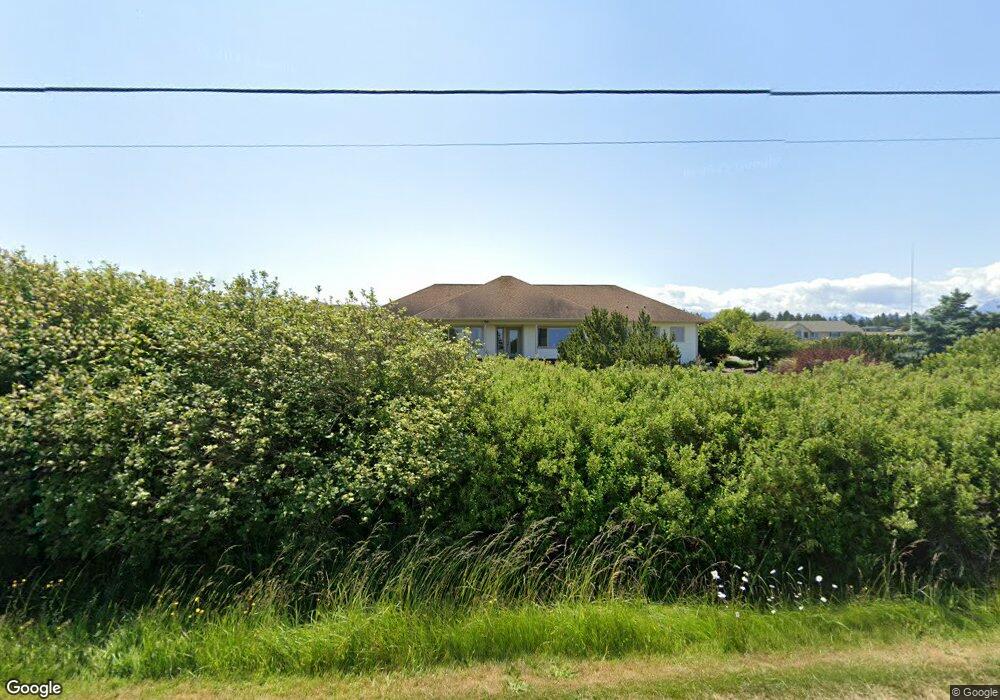
183 W Anderson Rd Sequim, WA 98382
Estimated Value: $740,000 - $798,000
3
Beds
3
Baths
1,854
Sq Ft
$411/Sq Ft
Est. Value
About This Home
This home is located at 183 W Anderson Rd, Sequim, WA 98382 and is currently estimated at $762,000, approximately $411 per square foot. 183 W Anderson Rd is a home located in Clallam County with nearby schools including Greywolf Elementary School, Sequim Middle School, and Sequim Senior High School.
Ownership History
Date
Name
Owned For
Owner Type
Purchase Details
Closed on
Jul 24, 2019
Sold by
Catelli Veronica Ann and Wiker Erik M
Bought by
Catelli Veronica Ann and Wiker Erik M
Current Estimated Value
Purchase Details
Closed on
Mar 19, 2015
Sold by
Catelli Veronica Ann
Bought by
Wiker Erik M
Home Financials for this Owner
Home Financials are based on the most recent Mortgage that was taken out on this home.
Original Mortgage
$310,000
Outstanding Balance
$236,196
Interest Rate
3.54%
Mortgage Type
New Conventional
Estimated Equity
$525,804
Purchase Details
Closed on
Jun 13, 2007
Sold by
Christensen Garn G and Christensen Teri A
Bought by
Catelli Ii William F and Catelli Veronica
Home Financials for this Owner
Home Financials are based on the most recent Mortgage that was taken out on this home.
Original Mortgage
$360,000
Interest Rate
6.21%
Mortgage Type
New Conventional
Create a Home Valuation Report for This Property
The Home Valuation Report is an in-depth analysis detailing your home's value as well as a comparison with similar homes in the area
Home Values in the Area
Average Home Value in this Area
Purchase History
| Date | Buyer | Sale Price | Title Company |
|---|---|---|---|
| Catelli Veronica Ann | -- | None Available | |
| Wiker Erik M | $155,000 | Clallam Title Company | |
| Catelli Veronica Ann | -- | None Available | |
| Catelli Ii William F | $450,000 | Olympic Peninsula Title Co |
Source: Public Records
Mortgage History
| Date | Status | Borrower | Loan Amount |
|---|---|---|---|
| Open | Wiker Erik M | $310,000 | |
| Previous Owner | Catelli Ii William F | $360,000 |
Source: Public Records
Tax History Compared to Growth
Tax History
| Year | Tax Paid | Tax Assessment Tax Assessment Total Assessment is a certain percentage of the fair market value that is determined by local assessors to be the total taxable value of land and additions on the property. | Land | Improvement |
|---|---|---|---|---|
| 2021 | $3,973 | $426,761 | $82,800 | $343,961 |
| 2020 | $4,268 | $410,382 | $82,800 | $327,582 |
| 2018 | $3,851 | $403,567 | $72,864 | $330,703 |
| 2017 | $3,199 | $374,699 | $82,800 | $291,899 |
| 2016 | $3,199 | $351,018 | $82,800 | $268,218 |
| 2015 | $3,199 | $339,478 | $92,115 | $247,363 |
| 2013 | $3,199 | $314,034 | $87,975 | $226,059 |
| 2012 | $3,199 | $319,304 | $93,150 | $226,154 |
Source: Public Records
Map
Nearby Homes
- 61 James St
- 50 E Nelson Rd
- 440 W Nelson Rd
- 999 Bay View St
- NKA Bay View St
- 241 Bay View St
- 1330 Thornton Dr
- 9999 Thornton Dr
- 73 Cobb Cir
- 62 Hogback Rd
- 104 Green Valley Ln
- 982 E Anderson Rd
- 151 Quail Meadows Dr
- 103 Secluded Way
- 83 Percy Ln
- 81 Meadow Lark Ln Unit 81 Meadow Lark Lane
- 50 Steve Place
- 21 Steve Place
- 9999 W Anderson Rd
- 185 W Anderson Rd
- 251 W Anderson Rd
- 123 W Anderson Rd
- 257 W Anderson Rd Unit Residence Address is
- 257 W Anderson Rd
- 257 W Anderson Rd
- 53 Arbor Ln
- 135 W Anderson Rd
- 134 W Anderson Rd
- 125 W Anderson Rd
- 65 W Anderson Rd
- 62 Arbor Ln
- 57 W Anderson Rd
- 62 W Anderson Rd
- 261 W Anderson Rd
- 261 W Anderson Rd
- 261 W Anderson Rd Unit 263 W. Anderson Road
- 82 Arbor Ln