183 Winding Soque Way Clarkesville, GA 30523
Estimated Value: $1,285,000 - $1,390,154
5
Beds
4
Baths
3,638
Sq Ft
$368/Sq Ft
Est. Value
About This Home
This home is located at 183 Winding Soque Way, Clarkesville, GA 30523 and is currently estimated at $1,337,577, approximately $367 per square foot. 183 Winding Soque Way is a home located in Habersham County with nearby schools including Clarkesville Elementary School, North Habersham Middle School, and Habersham Success Academy.
Ownership History
Date
Name
Owned For
Owner Type
Purchase Details
Closed on
Jul 13, 2021
Sold by
Hill Julius N
Bought by
Tuell Grady H and Tuell Sara V
Current Estimated Value
Home Financials for this Owner
Home Financials are based on the most recent Mortgage that was taken out on this home.
Original Mortgage
$150,000
Outstanding Balance
$135,446
Interest Rate
2.93%
Mortgage Type
New Conventional
Estimated Equity
$1,202,131
Purchase Details
Closed on
Jul 7, 2015
Sold by
Hill Pamela H
Bought by
Hill Julius N
Home Financials for this Owner
Home Financials are based on the most recent Mortgage that was taken out on this home.
Original Mortgage
$450,000
Interest Rate
4.08%
Mortgage Type
New Conventional
Purchase Details
Closed on
Jun 1, 2008
Sold by
Not Provided
Bought by
Hill Pamela H
Create a Home Valuation Report for This Property
The Home Valuation Report is an in-depth analysis detailing your home's value as well as a comparison with similar homes in the area
Home Values in the Area
Average Home Value in this Area
Purchase History
| Date | Buyer | Sale Price | Title Company |
|---|---|---|---|
| Tuell Grady H | $1,133,750 | -- | |
| Hill Julius N | -- | -- | |
| Hill Pamela H | -- | -- |
Source: Public Records
Mortgage History
| Date | Status | Borrower | Loan Amount |
|---|---|---|---|
| Open | Tuell Grady H | $150,000 | |
| Previous Owner | Hill Julius N | $450,000 |
Source: Public Records
Tax History Compared to Growth
Tax History
| Year | Tax Paid | Tax Assessment Tax Assessment Total Assessment is a certain percentage of the fair market value that is determined by local assessors to be the total taxable value of land and additions on the property. | Land | Improvement |
|---|---|---|---|---|
| 2025 | $6,461 | $671,793 | $316,596 | $355,197 |
| 2024 | -- | $565,164 | $201,740 | $363,424 |
| 2023 | $6,891 | $498,820 | $201,740 | $297,080 |
| 2022 | $6,447 | $437,644 | $182,460 | $255,184 |
| 2021 | $4,813 | $185,432 | $23,328 | $162,104 |
| 2020 | $4,460 | $165,832 | $23,328 | $142,504 |
| 2019 | $2,333 | $165,832 | $23,328 | $142,504 |
| 2018 | $4,430 | $165,832 | $23,328 | $142,504 |
| 2017 | $4,232 | $157,604 | $23,376 | $134,228 |
| 2016 | $4,110 | $394,010 | $23,376 | $134,228 |
| 2015 | $1,910 | $390,250 | $21,872 | $134,228 |
| 2014 | $1,910 | $383,810 | $21,872 | $131,652 |
| 2013 | -- | $153,400 | $21,748 | $131,652 |
Source: Public Records
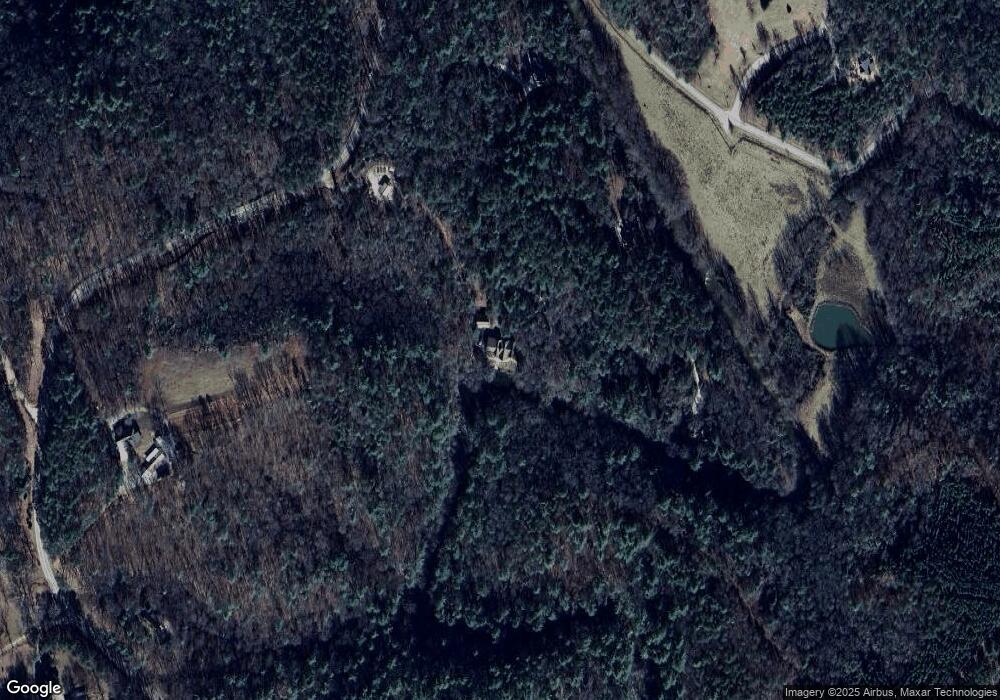
Map
Nearby Homes
- 101 Dove Ln
- 1613 Duchess Ln
- 0 Ben Jones Rd Unit 10333027
- 0 Ben Jones Rd Unit 7377215
- 0 Ben Jones Rd Unit 20180428
- 0 Ben Jones Rd Unit 10021237
- 0 TRACT 4 Annandale Dr
- 0 TRACT 3 Annandale Dr
- 0 TRACT 1 Annandale Dr
- 0 TRACT 2 Annandale Dr
- 1102 Soque Wilderness Rd
- 5265 New Liberty Rd
- 0 Barney Field Rd Unit 110.9 AC 10472662
- 274 Hardman Rd
- 182 Hardman Rd
- 150 Blue Jay Rd
- 0 Mountain Ridge Dr Unit 7628449
- 1947 Ivy Mountain Rd
- 135 Mountain Ridge Dr
- 220 Hardman Rd
- 375 Winding Soque Way
- 150 Winding Soque Way
- 400 Winding Soque Way
- 0 Ivy Mountain Rd Unit 6 LOTS 3085428
- 0 Ivy Mountain Rd Unit 10256293
- 0 Ivy Mountain Rd Unit 7340442
- 0 Ivy Mountain Rd Unit 10199849
- 0 Ivy Mountain Subdivision Unit 174 175 7214459
- 0 Ivy Mountain Rd Unit LOT 71 3149556
- 0 Ivy Mountain Rd Unit 9042114
- 0 Ivy Mountain Rd Unit 8786378
- 0 Ivy Mountain Rd Unit 8808916
- 0 Ivy Mountain Rd Unit 8848723
- 0 Ivy Mountain Rd Unit 7131103
- 0 Ivy Mountain Rd Unit 7195922
- 0 Ivy Mountain Rd Unit 7291012
- 0 Ivy Mountain Rd Unit 7462628
- 0 Ivy Mountain Rd Unit 8268022
- 0 Ivy Mountain Rd Unit 8412954
- 0 Ivy Mountain Rd Unit 8595815