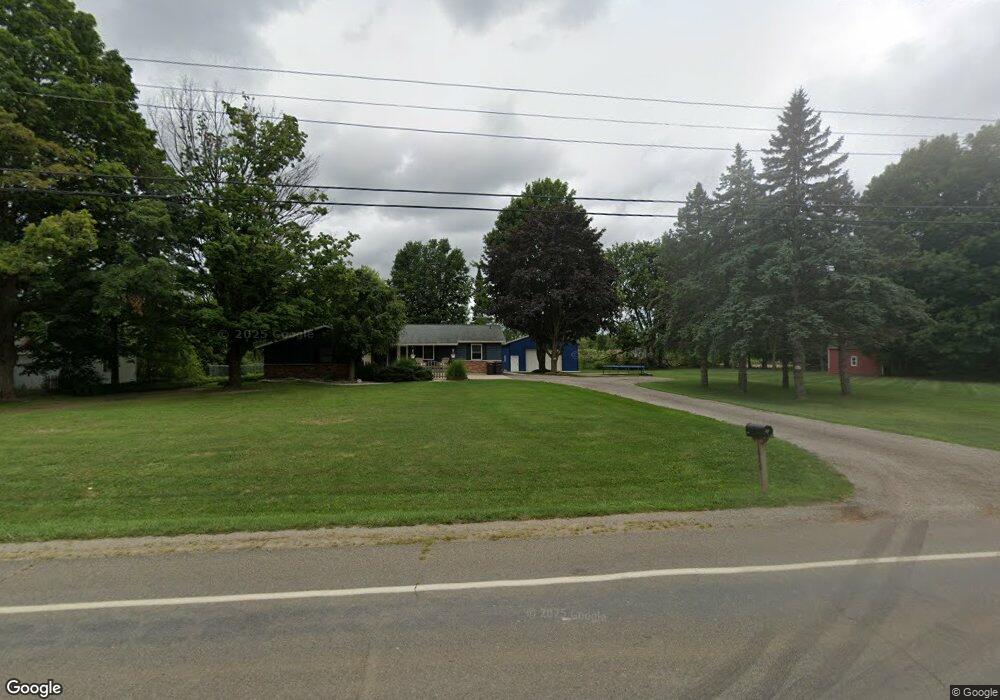
1830 76th St SW Byron Center, MI 49315
Estimated Value: $366,000 - $455,000
--
Bed
--
Bath
1,456
Sq Ft
$279/Sq Ft
Est. Value
About This Home
This home is located at 1830 76th St SW, Byron Center, MI 49315 and is currently estimated at $406,380, approximately $279 per square foot. 1830 76th St SW is a home located in Kent County with nearby schools including Brown Elementary School, Robert L. Nickels Intermediate School, and Byron Center West Middle School.
Ownership History
Date
Name
Owned For
Owner Type
Purchase Details
Closed on
May 6, 2021
Sold by
Vanas Devonne L and Piebenga Daneil R
Bought by
Piebenga Daniel Ryan and Vanas Devonne L
Current Estimated Value
Home Financials for this Owner
Home Financials are based on the most recent Mortgage that was taken out on this home.
Original Mortgage
$189,000
Outstanding Balance
$170,917
Interest Rate
3.1%
Mortgage Type
New Conventional
Estimated Equity
$235,463
Purchase Details
Closed on
Sep 25, 2020
Sold by
Vanas Devonne L
Bought by
Vanas Devonne L and Piebenga Daneil R
Purchase Details
Closed on
Jun 28, 2018
Sold by
Lilly Judy
Bought by
Venas Devonne L
Home Financials for this Owner
Home Financials are based on the most recent Mortgage that was taken out on this home.
Original Mortgage
$106,800
Interest Rate
4.6%
Mortgage Type
New Conventional
Create a Home Valuation Report for This Property
The Home Valuation Report is an in-depth analysis detailing your home's value as well as a comparison with similar homes in the area
Home Values in the Area
Average Home Value in this Area
Purchase History
| Date | Buyer | Sale Price | Title Company |
|---|---|---|---|
| Piebenga Daniel Ryan | -- | None Listed On Document | |
| Vanas Devonne L | -- | None Available | |
| Venas Devonne L | $178,000 | Star Title Agency Llc |
Source: Public Records
Mortgage History
| Date | Status | Borrower | Loan Amount |
|---|---|---|---|
| Open | Piebenga Daniel Ryan | $189,000 | |
| Previous Owner | Venas Devonne L | $106,800 |
Source: Public Records
Tax History Compared to Growth
Tax History
| Year | Tax Paid | Tax Assessment Tax Assessment Total Assessment is a certain percentage of the fair market value that is determined by local assessors to be the total taxable value of land and additions on the property. | Land | Improvement |
|---|---|---|---|---|
| 2025 | $3,025 | $196,600 | $0 | $0 |
| 2024 | $3,025 | $176,000 | $0 | $0 |
| 2023 | $2,893 | $153,300 | $0 | $0 |
| 2022 | $3,428 | $119,500 | $0 | $0 |
| 2021 | $3,336 | $111,400 | $0 | $0 |
| 2020 | $2,297 | $109,400 | $0 | $0 |
| 2019 | $3,271 | $104,700 | $0 | $0 |
| 2018 | $2,404 | $99,800 | $20,800 | $79,000 |
| 2017 | $2,333 | $87,700 | $0 | $0 |
| 2016 | $2,250 | $83,000 | $0 | $0 |
| 2015 | $2,224 | $83,000 | $0 | $0 |
| 2013 | -- | $71,800 | $0 | $0 |
Source: Public Records
Map
Nearby Homes
- 7609 Clementine Ave
- The Preston Plan at Alden Grove
- The Marley Plan at Alden Grove
- The Grayson Plan at Alden Grove
- The Crestview Plan at Alden Grove
- The Hadley Plan at Alden Grove
- The Maxwell Plan at Alden Grove
- The Stockton Plan at Alden Grove
- The Mayfair Plan at Alden Grove
- The Balsam Plan at Alden Grove
- The Newport Plan at Alden Grove
- The Sebastian Plan at Alden Grove
- The Jamestown Plan at Alden Grove
- The Georgetown Plan at Alden Grove
- The Fitzgerald Plan at Alden Grove
- The Sanibel Plan at Alden Grove
- The Wisteria Plan at Alden Grove
- The Hearthside Plan at Alden Grove
- 7732 Burlingame Ave SW
- 1752 Springwind Dr SW
- 1826 76th St SW
- 1804 76th St SW
- 1798 76th St SW
- 1870 76th St SW
- 1811 76th St SW
- 1775 Westminster Ct SW
- 1770 76th St SW
- 1847 76th St SW
- 1797 76th St SW
- 1771 Westminster Ct SW
- 1784 Westminster Ct SW
- 1744 76th St SW
- 1757 Westminster Ct SW
- 1771 76th St SW
- 1776 Westminster Ct SW
- 1768 Westminster Ct SW
- 1745 Westminster Ct SW
- 1889 76th St SW
- 7721 Worthing Ct SW
- 1752 Westminster Ct SW