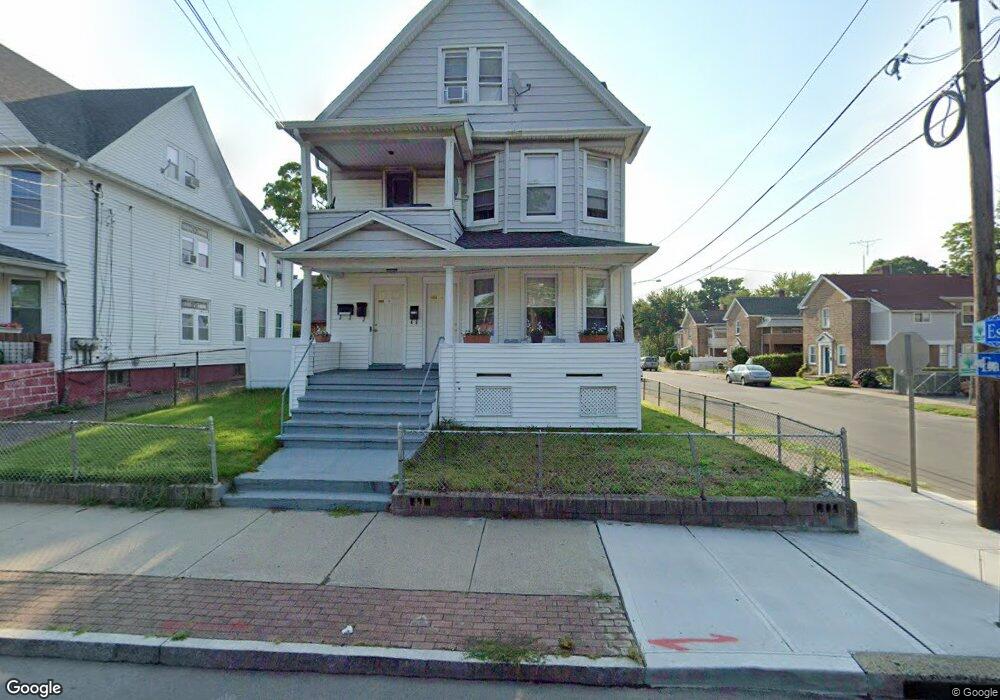
1830 E Main St Unit 3 Bridgeport, CT 06610
North Bridgeport NeighborhoodEstimated Value: $465,000 - $560,000
2
Beds
1
Bath
2,851
Sq Ft
$172/Sq Ft
Est. Value
About This Home
This home is located at 1830 E Main St Unit 3, Bridgeport, CT 06610 and is currently estimated at $489,674, approximately $171 per square foot. 1830 E Main St Unit 3 is a home located in Fairfield County with nearby schools including Beardsley School, Harding High School, and Achievement First Bridgeport Academy Elementary School.
Ownership History
Date
Name
Owned For
Owner Type
Purchase Details
Closed on
Apr 13, 2021
Sold by
Cornacchio James A
Bought by
1830 E Main St Ct Llc
Current Estimated Value
Home Financials for this Owner
Home Financials are based on the most recent Mortgage that was taken out on this home.
Original Mortgage
$252,000
Outstanding Balance
$225,738
Interest Rate
3.05%
Mortgage Type
Purchase Money Mortgage
Estimated Equity
$263,936
Purchase Details
Closed on
Jan 28, 2014
Sold by
Thomas Depeano Llc
Bought by
Cornaccio James
Home Financials for this Owner
Home Financials are based on the most recent Mortgage that was taken out on this home.
Original Mortgage
$173,597
Interest Rate
4.4%
Purchase Details
Closed on
Feb 27, 1995
Sold by
Berkeley Fed B & T
Bought by
Depeano Thomas A
Create a Home Valuation Report for This Property
The Home Valuation Report is an in-depth analysis detailing your home's value as well as a comparison with similar homes in the area
Home Values in the Area
Average Home Value in this Area
Purchase History
| Date | Buyer | Sale Price | Title Company |
|---|---|---|---|
| 1830 E Main St Ct Llc | $336,000 | None Available | |
| 1830 E Main St Ct Llc | $336,000 | None Available | |
| Cornaccio James | $176,800 | -- | |
| Cornaccio James | $176,800 | -- | |
| Depeano Thomas A | $70,000 | -- | |
| Depeano Thomas A | $70,000 | -- |
Source: Public Records
Mortgage History
| Date | Status | Borrower | Loan Amount |
|---|---|---|---|
| Open | 1830 E Main St Ct Llc | $252,000 | |
| Closed | 1830 E Main St Ct Llc | $252,000 | |
| Previous Owner | Depeano Thomas A | $168,170 | |
| Previous Owner | Depeano Thomas A | $169,037 | |
| Previous Owner | Depeano Thomas A | $173,597 |
Source: Public Records
Tax History
| Year | Tax Paid | Tax Assessment Tax Assessment Total Assessment is a certain percentage of the fair market value that is determined by local assessors to be the total taxable value of land and additions on the property. | Land | Improvement |
|---|---|---|---|---|
| 2025 | $6,592 | $151,704 | $30,164 | $121,540 |
| 2024 | $6,592 | $151,704 | $30,164 | $121,540 |
| 2023 | $6,592 | $151,704 | $30,164 | $121,540 |
| 2022 | $6,592 | $151,704 | $30,164 | $121,540 |
| 2021 | $6,592 | $151,704 | $30,164 | $121,540 |
| 2020 | $6,038 | $111,840 | $19,120 | $92,720 |
| 2019 | $6,038 | $111,840 | $19,120 | $92,720 |
| 2018 | $6,081 | $111,840 | $19,120 | $92,720 |
| 2017 | $6,081 | $111,840 | $19,120 | $92,720 |
| 2016 | $6,081 | $111,840 | $19,120 | $92,720 |
| 2015 | $6,276 | $148,710 | $29,350 | $119,360 |
| 2014 | $6,276 | $148,710 | $29,350 | $119,360 |
Source: Public Records
Map
Nearby Homes
- 386 Huntington Rd Unit 388
- 142 Palm St
- 2034 E Main St
- 2031 E Main St
- 282 Horace St
- 46 York St
- 2092 E Main St
- 2100 E Main St
- 107 Colony St Unit 109
- 1218 Kossuth St
- 619 Brooks St Unit 621
- 750 William St
- 502 Berkshire Ave
- 1365 E Main St
- 690 William St
- 369 Park St
- 34 Hayes St Unit 40
- 108 Lindley St Unit 114
- 1248 Pembroke St
- 274 Park St
- 1830 E Main St
- 1834 E Main St
- 8 Essex St
- 18 Essex St Unit 24
- 1844 E Main St
- 30 Essex St Unit 34
- 1825 E Main St
- 1747 E Main St
- 1842 E Main St
- 31 Essex St Unit 12
- 1786 E Main St
- 1786 E Main St Unit 1792
- 1791 E Main St
- 1841 E Main St
- 40 Essex St Unit 46
- 1782 E Main St
- 1776 E Main St
- 105 Bradley St
- 117 Bradley St
- 61 Bradley St
Your Personal Tour Guide
Ask me questions while you tour the home.