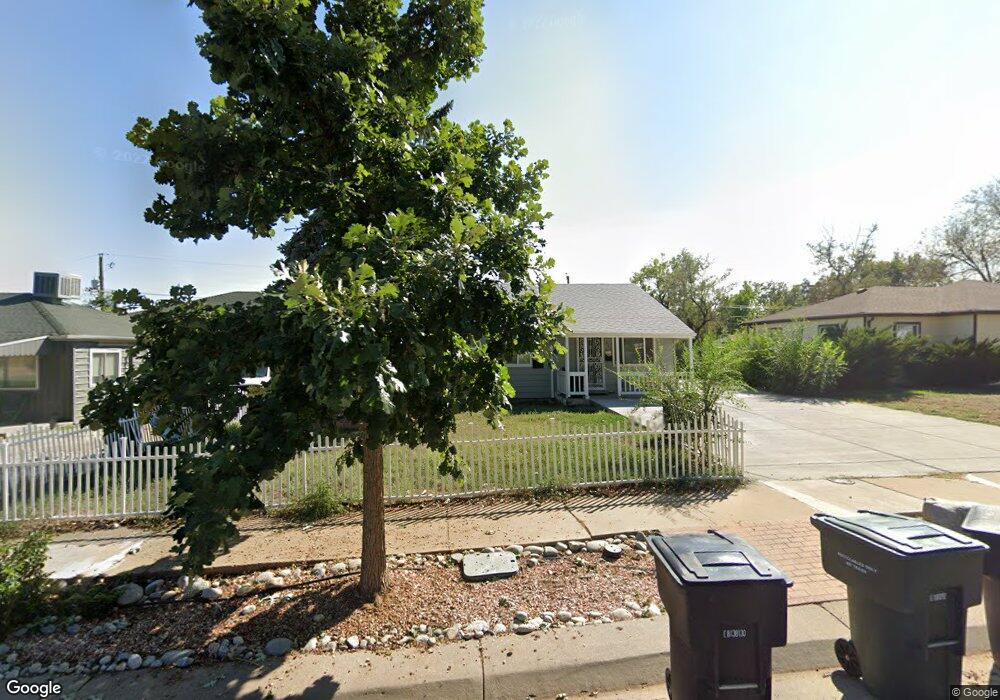
1830 Hoffman Way Thornton, CO 80229
South Thornton NeighborhoodEstimated Value: $375,000 - $425,000
4
Beds
2
Baths
1,320
Sq Ft
$306/Sq Ft
Est. Value
About This Home
This home is located at 1830 Hoffman Way, Thornton, CO 80229 and is currently estimated at $404,114, approximately $306 per square foot. 1830 Hoffman Way is a home located in Adams County with nearby schools including Trailside Academy and The New America School.
Ownership History
Date
Name
Owned For
Owner Type
Purchase Details
Closed on
Dec 5, 2019
Sold by
Angel Amanda A
Bought by
Vigil Kimberly Ann
Current Estimated Value
Home Financials for this Owner
Home Financials are based on the most recent Mortgage that was taken out on this home.
Original Mortgage
$309,294
Outstanding Balance
$273,867
Interest Rate
4.25%
Mortgage Type
FHA
Estimated Equity
$130,247
Purchase Details
Closed on
Jan 17, 2013
Sold by
Wilson Bret J
Bought by
Angel Amanda A
Home Financials for this Owner
Home Financials are based on the most recent Mortgage that was taken out on this home.
Original Mortgage
$144,045
Interest Rate
3.34%
Mortgage Type
New Conventional
Purchase Details
Closed on
Dec 7, 2001
Sold by
Baca Patricia and Baca Sunny
Bought by
Wilson Bret J
Home Financials for this Owner
Home Financials are based on the most recent Mortgage that was taken out on this home.
Original Mortgage
$138,050
Interest Rate
6.8%
Mortgage Type
FHA
Create a Home Valuation Report for This Property
The Home Valuation Report is an in-depth analysis detailing your home's value as well as a comparison with similar homes in the area
Home Values in the Area
Average Home Value in this Area
Purchase History
| Date | Buyer | Sale Price | Title Company |
|---|---|---|---|
| Vigil Kimberly Ann | $315,000 | Chicago Title Co | |
| Angel Amanda A | $148,500 | Heritage Title | |
| Wilson Bret J | $140,000 | -- |
Source: Public Records
Mortgage History
| Date | Status | Borrower | Loan Amount |
|---|---|---|---|
| Open | Vigil Kimberly Ann | $309,294 | |
| Previous Owner | Angel Amanda A | $144,045 | |
| Previous Owner | Wilson Bret J | $138,050 |
Source: Public Records
Tax History
| Year | Tax Paid | Tax Assessment Tax Assessment Total Assessment is a certain percentage of the fair market value that is determined by local assessors to be the total taxable value of land and additions on the property. | Land | Improvement |
|---|---|---|---|---|
| 2025 | $2,426 | $27,540 | $6,120 | $21,420 |
| 2024 | $2,426 | $25,320 | $5,630 | $19,690 |
| 2023 | $2,406 | $29,500 | $6,090 | $23,410 |
| 2022 | $2,078 | $20,850 | $5,280 | $15,570 |
| 2021 | $1,960 | $20,850 | $5,280 | $15,570 |
| 2020 | $1,885 | $20,260 | $5,430 | $14,830 |
| 2019 | $1,896 | $20,260 | $5,430 | $14,830 |
| 2018 | $1,524 | $15,330 | $5,180 | $10,150 |
| 2017 | $1,493 | $15,330 | $5,180 | $10,150 |
| 2016 | $1,009 | $10,150 | $2,550 | $7,600 |
| 2015 | $882 | $10,150 | $2,550 | $7,600 |
| 2014 | -- | $9,650 | $1,990 | $7,660 |
Source: Public Records
Map
Nearby Homes
- 1791 E 88th Ave
- 8861 Poze Blvd
- 8880 Hoyt Dr
- 8720 Faraday St
- 1411 E 89th Ave
- 8770 Rainbow Ave Unit A
- 1451 Elm Place
- 1050 Ash Ct
- 2020 Gail Ct
- 2469 Devonshire Ct Unit 34
- 990 Ash Ct
- 1050 Russell Blvd
- 8511 Franklin Dr
- 8771 Dawson St Unit 301
- 8741 Dawson St Unit 304
- 2529 Devonshire Ct Unit 64
- 9190 High St
- 2626 Devonshire Ct
- 2569 Devonshire Ct Unit 69
- 8731 Dawson St Unit 301
- 1790 Hoffman Way
- 1850 Hoffman Way
- 1831 E 88th Ave
- 1770 Hoffman Way
- 1851 E 88th Ave
- 1870 Hoffman Way
- 1771 E 88th Ave
- 8851 Utah Ct
- 1750 Hoffman Way
- 1871 E 88th Ave
- 1751 E 88th Ave
- 1880 Hoffman Way
- 8850 Lilly Dr
- 8850 Utah Ct
- 1730 Hoffman Way
- 8861 Utah Ct
- 1731 E 88th Ave
- 8860 Lilly Dr
- 8851 Hoyt Dr
- 1890 Hoffman Way
Your Personal Tour Guide
Ask me questions while you tour the home.