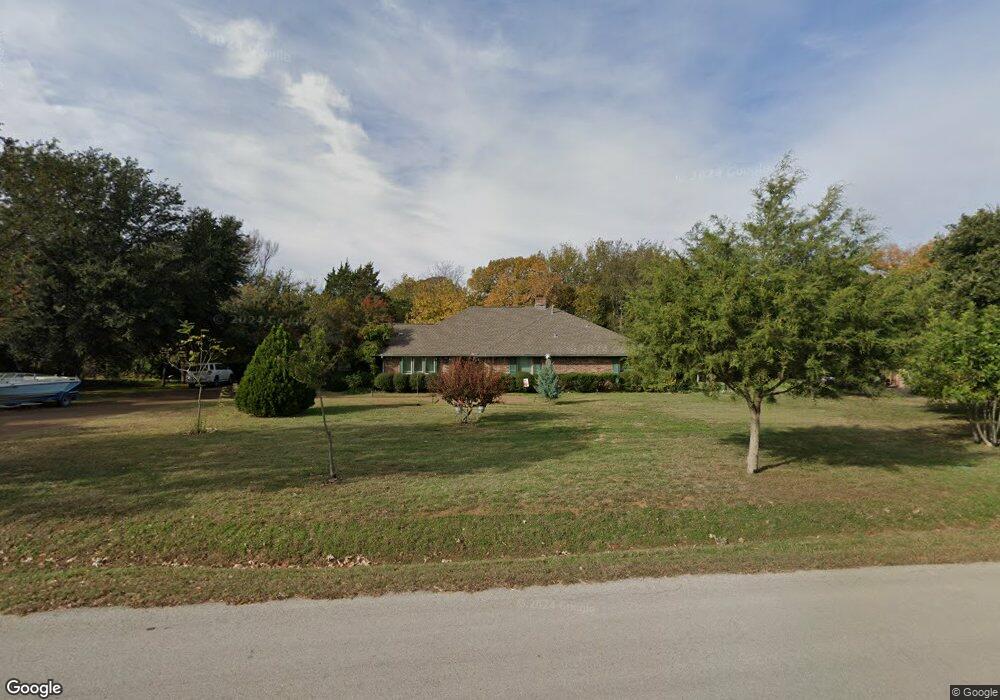
1830 Hunters Creek Dr Southlake, TX 76092
Estimated Value: $832,000 - $1,008,000
4
Beds
2
Baths
2,078
Sq Ft
$441/Sq Ft
Est. Value
About This Home
This home is located at 1830 Hunters Creek Dr, Southlake, TX 76092 and is currently estimated at $915,405, approximately $440 per square foot. 1830 Hunters Creek Dr is a home located in Tarrant County with nearby schools including Jack D. Johnson Elementary, Don T. Durham Intermediate School, and Carroll Middle School.
Ownership History
Date
Name
Owned For
Owner Type
Purchase Details
Closed on
Sep 2, 2025
Sold by
Burtea Catalin Nicolae and Lingvay Ildiko
Bought by
Burtea Family Trust and Burtea
Current Estimated Value
Purchase Details
Closed on
Apr 29, 2004
Sold by
Brown Rick Lee and Stewart Tina M
Bought by
Burtea Catalin Nicolae and Linguay Ildiko
Home Financials for this Owner
Home Financials are based on the most recent Mortgage that was taken out on this home.
Original Mortgage
$164,000
Interest Rate
5.38%
Mortgage Type
New Conventional
Purchase Details
Closed on
Oct 27, 1999
Sold by
Ohara Reaburn J
Bought by
Brown Rick Lee and Stewart Tina M
Home Financials for this Owner
Home Financials are based on the most recent Mortgage that was taken out on this home.
Original Mortgage
$202,980
Interest Rate
7.85%
Mortgage Type
VA
Create a Home Valuation Report for This Property
The Home Valuation Report is an in-depth analysis detailing your home's value as well as a comparison with similar homes in the area
Home Values in the Area
Average Home Value in this Area
Purchase History
| Date | Buyer | Sale Price | Title Company |
|---|---|---|---|
| Burtea Family Trust | -- | None Listed On Document | |
| Burtea Catalin Nicolae | -- | Richard M Kilgore Title Srvs | |
| Brown Rick Lee | -- | Southwest Land Title |
Source: Public Records
Mortgage History
| Date | Status | Borrower | Loan Amount |
|---|---|---|---|
| Previous Owner | Burtea Catalin Nicolae | $164,000 | |
| Previous Owner | Brown Rick Lee | $202,980 | |
| Closed | Burtea Catalin Nicolae | $20,500 |
Source: Public Records
Tax History Compared to Growth
Tax History
| Year | Tax Paid | Tax Assessment Tax Assessment Total Assessment is a certain percentage of the fair market value that is determined by local assessors to be the total taxable value of land and additions on the property. | Land | Improvement |
|---|---|---|---|---|
| 2025 | $10,860 | $620,932 | $443,445 | $177,487 |
| 2024 | $10,860 | $620,932 | $443,445 | $177,487 |
| 2023 | $11,334 | $621,817 | $443,445 | $178,372 |
| 2022 | $12,262 | $568,379 | $316,412 | $251,967 |
| 2021 | $9,644 | $423,000 | $316,412 | $106,588 |
| 2020 | $8,735 | $380,000 | $378,292 | $1,708 |
| 2019 | $9,202 | $380,000 | $378,292 | $1,708 |
| 2018 | $8,378 | $346,000 | $185,438 | $160,562 |
| 2017 | $9,915 | $400,000 | $185,438 | $214,562 |
| 2016 | $8,893 | $358,800 | $247,250 | $111,550 |
| 2015 | $5,547 | $221,590 | $50,000 | $171,590 |
| 2014 | $5,547 | $221,590 | $50,000 | $171,590 |
Source: Public Records
Map
Nearby Homes
- 1920 Fox Hollow Cir
- 1497 E Dove Rd
- 1700 Live Oak Ln
- 1621 Carruth Ln
- 3300 Jackson Ct
- 1469 Sunshine Ln
- 1459 Sunshine Ln
- 1963 E Dove Rd
- 1013 Winfield Ct
- 3405 Witt Ct
- 3316 Ferguson Rd
- 2040 E Dove Rd
- 3401 Witt Ct
- 3321 Ferguson Rd
- 3325 Ferguson Rd
- 2080 E Dove Rd Unit Lot 4
- 2080 E Dove Rd Unit Lots 1, 2, 4, 5, 6
- 2080 E Dove Rd Unit Lot 2
- 2080 E (Lot 1) Dove Rd
- 2080 E Dove Rd Unit Lot 6
- 1820 Hunters Creek Dr
- 1850 Hunters Creek Dr
- 1810 Hunters Creek Dr
- 1401 Bay Meadows Dr
- 1860 Hunters Creek Dr
- 1800 Hunters Creek Dr
- 1405 Bay Meadows Dr
- 1840 Hunters Creek Dr
- 1325 Bay Meadows Dr
- 1790 Hunters Creek Dr
- 1321 Bay Meadows Dr
- 1720 Live Oak Ln
- 1409 Bay Meadows Dr
- 1317 Bay Meadows Dr
- 1960 Fox Hollow Cir
- 1417 Bay Meadows Dr
- 1780 Hunters Creek Dr
- 1313 Bay Meadows Dr
- 1725 Bur Oak Dr
- 1716 Live Oak Ln