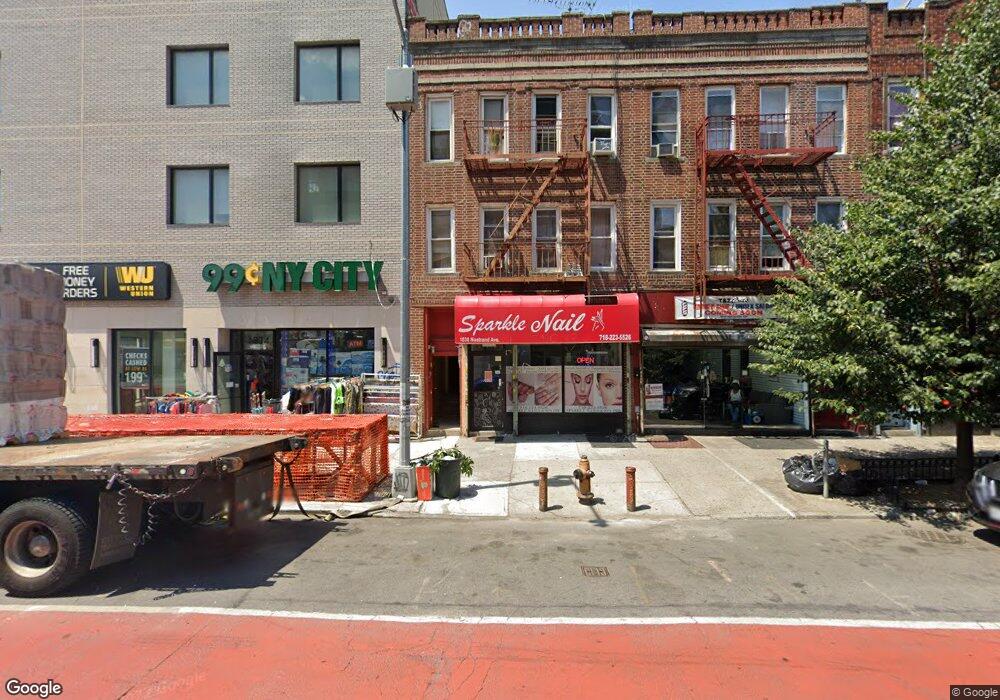
1830 Nostrand Ave Unit 5 Brooklyn, NY 11226
Flatbush NeighborhoodEstimated Value: $1,151,388
--
Bed
--
Bath
5,100
Sq Ft
$226/Sq Ft
Est. Value
About This Home
This home is located at 1830 Nostrand Ave Unit 5, Brooklyn, NY 11226 and is currently estimated at $1,151,388, approximately $225 per square foot. 1830 Nostrand Ave Unit 5 is a home located in Kings County with nearby schools including Middle School 246 Walt Whitman, Central Brooklyn Ascend Charter, and Flatbush Ascend Charter School.
Ownership History
Date
Name
Owned For
Owner Type
Purchase Details
Closed on
Jun 27, 2024
Sold by
Jean-Baptiste Gerald
Bought by
Bh Nostrand Llc
Current Estimated Value
Home Financials for this Owner
Home Financials are based on the most recent Mortgage that was taken out on this home.
Original Mortgage
$400,000
Outstanding Balance
$395,186
Interest Rate
6.95%
Mortgage Type
Purchase Money Mortgage
Estimated Equity
$756,202
Purchase Details
Closed on
Nov 4, 2013
Sold by
Jean-Baptiste Gerald and Jean-Baptiste Raymond Rones
Bought by
Jean-Baptiste Gerald
Purchase Details
Closed on
May 10, 2005
Sold by
Powell Loretta and Powell Owen
Bought by
Jean-Baptiste Gerald and Jean-Baptiste Raymond Rones
Home Financials for this Owner
Home Financials are based on the most recent Mortgage that was taken out on this home.
Original Mortgage
$437,250
Interest Rate
5.94%
Mortgage Type
Commercial
Create a Home Valuation Report for This Property
The Home Valuation Report is an in-depth analysis detailing your home's value as well as a comparison with similar homes in the area
Home Values in the Area
Average Home Value in this Area
Purchase History
| Date | Buyer | Sale Price | Title Company |
|---|---|---|---|
| Bh Nostrand Llc | $1,100,000 | -- | |
| Jean-Baptiste Gerald | -- | -- | |
| Jean-Baptiste Gerald | -- | -- | |
| Jean-Baptiste Gerald | $583,000 | -- | |
| Jean-Baptiste Gerald | $583,000 | -- |
Source: Public Records
Mortgage History
| Date | Status | Borrower | Loan Amount |
|---|---|---|---|
| Open | Bh Nostrand Llc | $400,000 | |
| Previous Owner | Jean-Baptiste Gerald | $437,250 |
Source: Public Records
Tax History Compared to Growth
Tax History
| Year | Tax Paid | Tax Assessment Tax Assessment Total Assessment is a certain percentage of the fair market value that is determined by local assessors to be the total taxable value of land and additions on the property. | Land | Improvement |
|---|---|---|---|---|
| 2025 | $15,803 | $412,650 | $8,100 | $404,550 |
| 2024 | $15,803 | $343,980 | $8,100 | $335,880 |
| 2023 | $15,506 | $286,650 | $8,100 | $278,550 |
| 2022 | $14,950 | $238,950 | $8,100 | $230,850 |
| 2021 | $13,880 | $280,350 | $8,100 | $272,250 |
| 2020 | $6,318 | $280,350 | $8,100 | $272,250 |
| 2019 | $12,263 | $350,640 | $8,100 | $342,540 |
| 2018 | $12,367 | $97,233 | $1,797 | $95,436 |
| 2017 | $11,955 | $93,995 | $2,012 | $91,983 |
| 2016 | $11,221 | $87,035 | $2,056 | $84,979 |
| 2015 | $7,284 | $80,588 | $1,891 | $78,697 |
| 2014 | $7,284 | $74,795 | $2,107 | $72,688 |
Source: Public Records
Map
Nearby Homes
- 1776 Nostrand Ave
- 349 E 28th St
- 1773 Nostrand Ave
- 381 E 31st St
- 332 E 28th St
- 1173 Rogers Ave Unit 4 C
- 1173 Rogers Ave Unit 5 B
- 1193 Rogers Ave
- 2724 Clarendon Rd Unit 1
- 448 E 29th St
- 2701 Newkirk Ave Unit 3H
- 2701 Newkirk Ave Unit 3D
- 2701 Newkirk Ave Unit 7F
- 2701 Newkirk Ave Unit 3A
- 2701 Newkirk Ave Unit 7A
- 455 E 28th St
- 259 E 28th St Unit 3
- 1322 New York Ave
- 357 E 26th St
- 2913 Foster Ave Unit 3D
- 1830 Nostrand Ave
- 1828 Nostrand Ave
- 1828 Nostrand Ave Unit 5
- 1826 Nostrand Ave
- 1826 Nostrand Ave Unit 5
- 2911 Avenue D
- 1838 Nostrand Ave
- 2909 Avenue D
- 2905 Avenue D
- 1820 Nostrand Ave Unit 5
- 377 E 29th St
- 375 E 29th St
- 1818 Nostrand Ave Unit 4
- 2903 Avenue D
- 373 E 29th St
- 373 E 29th St Unit 1
- 371 E 29th St
- 1840 Nostrand Ave
- 2901 Avenue D Unit 2F
- 2901 Avenue D