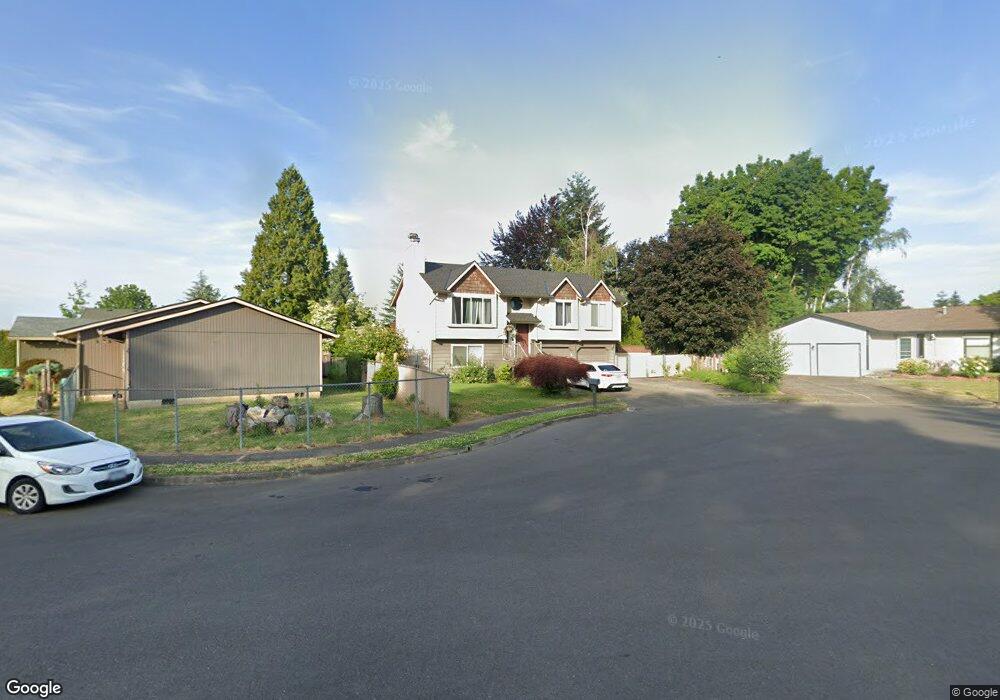
1830 SE Hale Place Gresham, OR 97080
Mount Hood NeighborhoodEstimated Value: $442,000 - $477,232
3
Beds
2
Baths
1,528
Sq Ft
$303/Sq Ft
Est. Value
About This Home
This home is located at 1830 SE Hale Place, Gresham, OR 97080 and is currently estimated at $462,808, approximately $302 per square foot. 1830 SE Hale Place is a home located in Multnomah County with nearby schools including Hogan Cedars Elementary School, West Orient Middle School, and Sam Barlow High School.
Ownership History
Date
Name
Owned For
Owner Type
Purchase Details
Closed on
Dec 27, 2021
Sold by
Ray Knigge Donald
Bought by
Sheaffer George
Current Estimated Value
Home Financials for this Owner
Home Financials are based on the most recent Mortgage that was taken out on this home.
Original Mortgage
$12,600
Outstanding Balance
$11,520
Interest Rate
3.55%
Estimated Equity
$451,288
Purchase Details
Closed on
Sep 23, 2013
Sold by
Knigge Donald Ray
Bought by
Knigge Donald Ray and Manning Randy Paul
Purchase Details
Closed on
Jun 13, 2013
Sold by
Wolbert Lee J
Bought by
Knigge Donald R
Purchase Details
Closed on
Feb 28, 1995
Sold by
Jost Karlheinz
Bought by
Wolbert Lee J and Wolbert Katherine L
Home Financials for this Owner
Home Financials are based on the most recent Mortgage that was taken out on this home.
Original Mortgage
$91,800
Interest Rate
9.09%
Mortgage Type
Purchase Money Mortgage
Create a Home Valuation Report for This Property
The Home Valuation Report is an in-depth analysis detailing your home's value as well as a comparison with similar homes in the area
Home Values in the Area
Average Home Value in this Area
Purchase History
We collect this data history from publicly available records. To have your information removed, we recommend requesting removal directly through your county’s website.
| Date | Buyer | Sale Price | Title Company |
|---|---|---|---|
| Sheaffer George | $360,000 | First American Title | |
| Knigge Donald Ray | -- | None Available | |
| Knigge Donald R | $209,000 | First American | |
| Wolbert Lee J | $122,425 | Stewart Title |
Source: Public Records
Mortgage History
We collect this data history from publicly available records. To have your information removed, we recommend requesting removal directly through your county’s website.
| Date | Status | Borrower | Loan Amount |
|---|---|---|---|
| Open | Sheaffer George | $12,600 | |
| Open | Sheaffer George | $353,479 | |
| Previous Owner | Wolbert Lee J | $91,800 |
Source: Public Records
Tax History
| Year | Tax Paid | Tax Assessment Tax Assessment Total Assessment is a certain percentage of the fair market value that is determined by local assessors to be the total taxable value of land and additions on the property. | Land | Improvement |
|---|---|---|---|---|
| 2025 | $5,293 | $260,110 | -- | -- |
| 2024 | $5,067 | $252,540 | -- | -- |
| 2023 | $5,067 | $245,190 | -- | -- |
| 2022 | $4,487 | $238,050 | $0 | $0 |
| 2021 | $4,374 | $231,120 | $0 | $0 |
| 2020 | $4,116 | $224,390 | $0 | $0 |
| 2019 | $4,008 | $217,860 | $0 | $0 |
| 2018 | $3,822 | $211,520 | $0 | $0 |
| 2017 | $3,667 | $205,360 | $0 | $0 |
| 2016 | $3,233 | $199,380 | $0 | $0 |
| 2015 | $3,163 | $193,580 | $0 | $0 |
| 2014 | $3,086 | $187,950 | $0 | $0 |
Source: Public Records
Map
Nearby Homes
- 2021 SE Hale Dr
- 2696 SE Palmquist Rd
- 2278 SE Kane Ave
- 3689 SE 14th St
- 2037 SE Centurion Way
- 3670 SE 21st Dr
- 2240 SE 16th St
- 2220 SE 16th St
- 3780 SE 21st Dr
- 2624 SE Hale Way
- 2137 SE 15th Aly
- 3133 SE 28th St
- 1230 SE Barnes Rd
- 1053 SE Barnes Rd
- 3788 SE 25th St
- 2910 SE Hillyard Rd
- 933 SE Rene Ave Unit 935
- 3355 SE 30th St
- 4117 SE 12th St
- 1949 SE Palmquist Rd Unit 51
- 1755 SE Hale Ave
- 1725 SE Hale Ave
- 3037 SE 17th St
- 1740 SE Hale Dr
- 1740 SE Hale Ave
- 1750 SE Hale Ave
- 3058 SE 17th St
- 1720 SE Hale Ave
- 1790 SE Hale Ave
- 3029 SE 17th St
- 3034 SE 17th St
- 1695 SE Hale Ave
- 1825 SE Hale Dr
- 1690 SE Hale Ave
- 1840 SE Hale Dr
- 1820 SE Hale Place
- 3026 SE 16th St
- 3020 SE 17th St
- 3015 SE 17th St
- 1845 SE Hale Dr
Your Personal Tour Guide
Ask me questions while you tour the home.