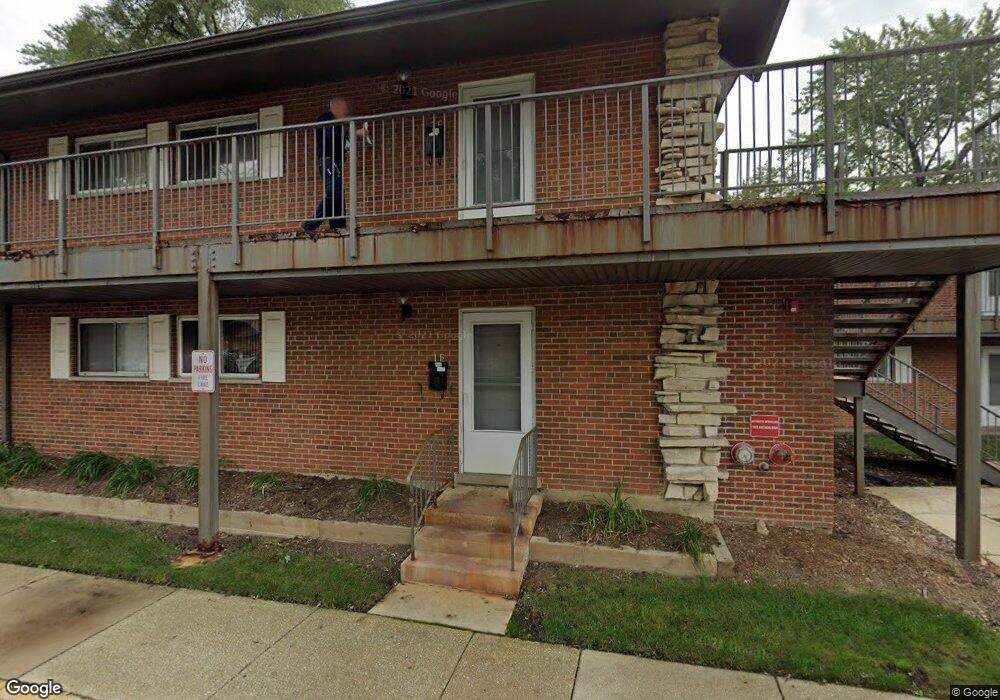
1830 W Knightsbridge Dr Unit 183 Mount Prospect, IL 60056
Mount Shire NeighborhoodEstimated Value: $160,000 - $188,000
1
Bed
1
Bath
1,000
Sq Ft
$173/Sq Ft
Est. Value
About This Home
This home is located at 1830 W Knightsbridge Dr Unit 183, Mount Prospect, IL 60056 and is currently estimated at $172,782, approximately $172 per square foot. 1830 W Knightsbridge Dr Unit 183 is a home located in Cook County with nearby schools including Holmes Jr High School, John Jay Elementary School, and Rolling Meadows High School.
Ownership History
Date
Name
Owned For
Owner Type
Purchase Details
Closed on
Sep 9, 2010
Sold by
Deutsche Bank National Trust Company
Bought by
Wang Zewen and Wang Xiaohong
Current Estimated Value
Purchase Details
Closed on
May 7, 2010
Sold by
Leptich Andrew
Bought by
Deutsche Bank National Trust Company
Purchase Details
Closed on
Jun 21, 2006
Sold by
Giron Oralia
Bought by
Leptich Andrew
Home Financials for this Owner
Home Financials are based on the most recent Mortgage that was taken out on this home.
Original Mortgage
$121,600
Interest Rate
7.9%
Mortgage Type
Unknown
Purchase Details
Closed on
Feb 21, 2006
Sold by
Dover Park Inc
Bought by
Giron Oralia
Home Financials for this Owner
Home Financials are based on the most recent Mortgage that was taken out on this home.
Original Mortgage
$106,110
Interest Rate
6.54%
Mortgage Type
Fannie Mae Freddie Mac
Create a Home Valuation Report for This Property
The Home Valuation Report is an in-depth analysis detailing your home's value as well as a comparison with similar homes in the area
Home Values in the Area
Average Home Value in this Area
Purchase History
| Date | Buyer | Sale Price | Title Company |
|---|---|---|---|
| Wang Zewen | $49,000 | None Available | |
| Deutsche Bank National Trust Company | -- | None Available | |
| Leptich Andrew | $152,000 | Superior Title Co | |
| Giron Oralia | $118,000 | Cti |
Source: Public Records
Mortgage History
| Date | Status | Borrower | Loan Amount |
|---|---|---|---|
| Previous Owner | Leptich Andrew | $121,600 | |
| Previous Owner | Giron Oralia | $106,110 |
Source: Public Records
Tax History Compared to Growth
Tax History
| Year | Tax Paid | Tax Assessment Tax Assessment Total Assessment is a certain percentage of the fair market value that is determined by local assessors to be the total taxable value of land and additions on the property. | Land | Improvement |
|---|---|---|---|---|
| 2024 | $2,894 | $11,106 | $810 | $10,296 |
| 2023 | $2,779 | $11,106 | $810 | $10,296 |
| 2022 | $2,779 | $11,106 | $810 | $10,296 |
| 2021 | $2,280 | $7,979 | $501 | $7,478 |
| 2020 | $2,219 | $7,979 | $501 | $7,478 |
| 2019 | $2,240 | $8,865 | $501 | $8,364 |
| 2018 | $1,577 | $5,525 | $424 | $5,101 |
| 2017 | $1,582 | $5,525 | $424 | $5,101 |
| 2016 | $1,488 | $5,525 | $424 | $5,101 |
| 2015 | $1,588 | $5,501 | $385 | $5,116 |
| 2014 | $1,562 | $5,501 | $385 | $5,116 |
| 2013 | $1,526 | $5,501 | $385 | $5,116 |
Source: Public Records
Map
Nearby Homes
- 1900 W Knightsbridge Dr Unit 2B
- 1500 S Busse Rd Unit 2D
- 1910 W Hatherleigh Ct Unit 2A
- 1915 Whitechapel Dr Unit 1E
- 1429 S Busse Rd
- 1717 W Crystal Ln Unit 701
- 1785 W Algonquin Rd Unit 2A
- 1115 E Algonquin Rd Unit 8
- 1747 W Crystal Ln Unit 308
- 1777 W Crystal Ln Unit 410
- 1777 W Crystal Ln Unit 711
- 1111 E Algonquin Rd Unit 1
- 1721 W Catalpa Ln
- 1119 E Algonquin Rd Unit 7
- 1107 E Algonquin Rd Unit 4
- 1822 W Pheasant Trail
- 728 Dempster St Unit 210
- 1602 W Willow Ln
- 712 W Dempster St Unit FG10
- 758 Dempster St Unit DG5
- 1900 W Knightsbridge Dr Unit 2A
- 1505 S Canford Cliffs Dr Unit 1B
- 1805 W Hatherleigh Ct
- 1805 W Hatherleigh Ct Unit 2E
- 1800 W Knightsbridge Dr Unit 1D
- 1805 W Hatherleigh Ct Unit 1805
- 1800 W Knightsbridge Dr Unit 180
- 1505 S Canford Cliffs Dr Unit 1
- 1500 S Busse Rd Unit 15001A
- 1830 W Knightsbridge Dr Unit 2E
- 1500 S Busse Rd Unit 15002C
- 1805 W Hatherleigh Ct Unit 1805
- 1800 W Knightsbridge Dr Unit 180
- 1505 S Canford Cliffs Dr Unit 1
- 1900 W Knightsbridge Dr Unit 190
- 1505 S Canford Cliffs Dr Unit 1
- 1900 W Knightsbridge Dr Unit 190
- 1905 W Hatherleigh Ct Unit 1905
- 1505 S Canford Cliffs Dr Unit 1
- 1900 W Knightsbridge Dr Unit 190