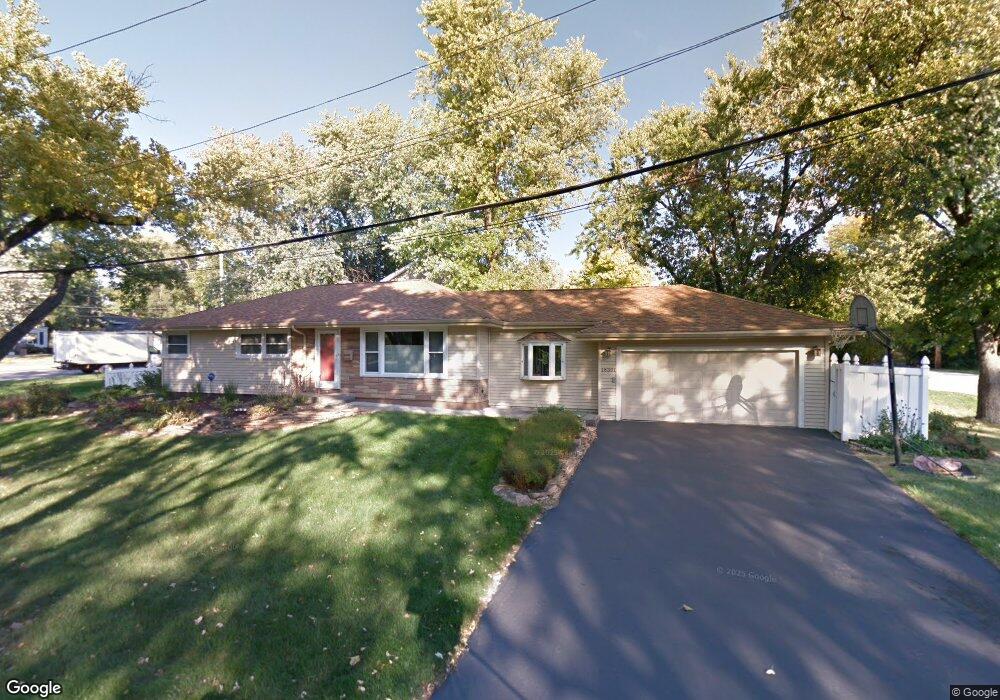
18301 Stewart Ave Homewood, IL 60430
Estimated Value: $221,000 - $246,000
3
Beds
1
Bath
1,242
Sq Ft
$186/Sq Ft
Est. Value
About This Home
This home is located at 18301 Stewart Ave, Homewood, IL 60430 and is currently estimated at $231,335, approximately $186 per square foot. 18301 Stewart Ave is a home located in Cook County with nearby schools including Western Avenue Elementary School, Parker Junior High School, and Homewood-Flossmoor High School.
Ownership History
Date
Name
Owned For
Owner Type
Purchase Details
Closed on
May 22, 2021
Sold by
Holder Anthony W and Benodin Marie J
Bought by
Holder Anthony M and Holder Marie J
Current Estimated Value
Home Financials for this Owner
Home Financials are based on the most recent Mortgage that was taken out on this home.
Original Mortgage
$108,000
Outstanding Balance
$80,208
Interest Rate
2.1%
Mortgage Type
New Conventional
Estimated Equity
$151,127
Purchase Details
Closed on
Nov 20, 1997
Sold by
Harmon Peter G and Harmon Kristi
Bought by
Holder Anthony W and Benodin Marie J
Home Financials for this Owner
Home Financials are based on the most recent Mortgage that was taken out on this home.
Original Mortgage
$113,650
Interest Rate
7.38%
Mortgage Type
FHA
Create a Home Valuation Report for This Property
The Home Valuation Report is an in-depth analysis detailing your home's value as well as a comparison with similar homes in the area
Home Values in the Area
Average Home Value in this Area
Purchase History
| Date | Buyer | Sale Price | Title Company |
|---|---|---|---|
| Holder Anthony M | -- | Citywide Title Corporation | |
| Holder Anthony W | $114,500 | Intercounty Title |
Source: Public Records
Mortgage History
| Date | Status | Borrower | Loan Amount |
|---|---|---|---|
| Open | Holder Anthony M | $108,000 | |
| Closed | Holder Anthony W | $113,650 |
Source: Public Records
Tax History Compared to Growth
Tax History
| Year | Tax Paid | Tax Assessment Tax Assessment Total Assessment is a certain percentage of the fair market value that is determined by local assessors to be the total taxable value of land and additions on the property. | Land | Improvement |
|---|---|---|---|---|
| 2024 | $4,558 | $15,211 | $3,412 | $11,799 |
| 2023 | $4,221 | $15,211 | $3,412 | $11,799 |
| 2022 | $4,221 | $12,021 | $2,967 | $9,054 |
| 2021 | $4,265 | $12,021 | $2,967 | $9,054 |
| 2020 | $4,198 | $12,021 | $2,967 | $9,054 |
| 2019 | $5,425 | $14,430 | $2,670 | $11,760 |
| 2018 | $5,280 | $14,430 | $2,670 | $11,760 |
| 2017 | $5,213 | $14,430 | $2,670 | $11,760 |
| 2016 | $4,393 | $11,502 | $2,373 | $9,129 |
| 2015 | $4,344 | $11,502 | $2,373 | $9,129 |
| 2014 | $4,282 | $11,502 | $2,373 | $9,129 |
| 2013 | $5,011 | $14,044 | $2,373 | $11,671 |
Source: Public Records
Map
Nearby Homes
- 18330 Perth Ave
- 18404 Perth Ave
- 18210 Perth Ave
- 18418 Clyde Rd
- 18157 Rockwell Ave
- 18450 Stedhall Rd
- 18509 Stedhall Rd
- 18340 Cherry Creek Dr Unit 7
- 18530 Stedhall Rd
- 2619 Alexander St
- 18400 Cherry Creek Dr Unit 105
- 625 Perth Ave
- 2807 Willow Rd Unit 103
- 18051 Los Angeles Ave
- 18104 Park Ave
- 710 Bruce Ave
- 2055 183rd St
- 18461 Morris Ave
- 18646 Palmer Cir
- 18134 Martin Ave Unit 18134
- 18300 Stewart Ave
- 2520 Crescent Rd
- 2531 Crescent Rd
- 2551 183rd St
- 18333 Stewart Ave
- 2534 183rd St
- 18324 Perth Ave
- 2528 183rd St
- 2550 Crescent Rd
- 2522 183rd St
- 18339 Stewart Ave
- 18315 Argyle Ave
- 18256 Perth Ave
- 18334 Perth Ave
- 18340 Stewart Ave
- 18343 Stewart Ave
- 18251 Stewart Ave
- 18338 Perth Ave
- 2556 183rd St
- 18344 Stewart Ave