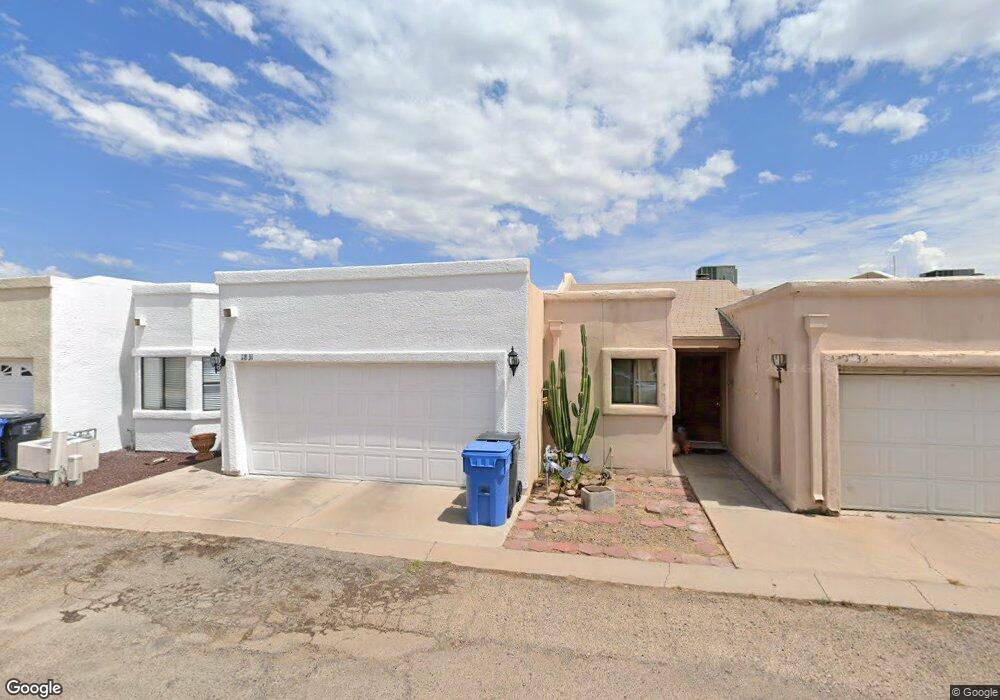
1831 N San Carlos Loop Nogales, AZ 85621
Estimated Value: $240,386 - $320,000
--
Bed
2
Baths
1,823
Sq Ft
$156/Sq Ft
Est. Value
About This Home
This home is located at 1831 N San Carlos Loop, Nogales, AZ 85621 and is currently estimated at $283,597, approximately $155 per square foot. 1831 N San Carlos Loop is a home located in Santa Cruz County with nearby schools including Nogales High School, Mexicayotl Academy, and Colegio Petite Arizona.
Create a Home Valuation Report for This Property
The Home Valuation Report is an in-depth analysis detailing your home's value as well as a comparison with similar homes in the area
Home Values in the Area
Average Home Value in this Area
Tax History Compared to Growth
Tax History
| Year | Tax Paid | Tax Assessment Tax Assessment Total Assessment is a certain percentage of the fair market value that is determined by local assessors to be the total taxable value of land and additions on the property. | Land | Improvement |
|---|---|---|---|---|
| 2025 | $1,619 | $19,305 | $1,664 | $17,641 |
| 2024 | $1,619 | $20,086 | $1,664 | $18,422 |
| 2023 | $1,377 | $16,723 | $1,664 | $15,059 |
| 2022 | $1,310 | $14,325 | $1,664 | $12,661 |
| 2021 | $1,305 | $13,168 | $1,664 | $11,504 |
| 2020 | $1,328 | $13,287 | $1,664 | $11,623 |
| 2019 | $1,341 | $13,776 | $1,664 | $12,112 |
| 2018 | $1,303 | $13,311 | $1,664 | $11,647 |
| 2017 | $1,233 | $12,677 | $1,664 | $11,013 |
| 2016 | $1,360 | $12,928 | $1,664 | $11,264 |
| 2015 | $1,314 | $12,740 | $0 | $0 |
Source: Public Records
Map
Nearby Homes
- 329 W Santa Barbara St
- 442 E Calle Sonora
- 453 E Calle Socorro
- 0 E Baffert Dr Unit 22502358
- 2337 N Calle Santa Ana
- 522 E Calle Nacozari
- 2601 N Grand Ave Unit W-1
- 920 W Mariposa Hills Dr
- 2320 N Calle Cananea
- 510 W Valle Verde Place Unit 1
- 925 N Santa Cruz St
- 220 W Kolver St
- 2640 N Green Place
- 756 W Stephenson St
- 682 W Western Place
- 814 N Perkins Ave
- 2735 N Silver Reef Dr
- 0 N Siqueiros St Unit 22522179
- 51 E Grant St
- 444 W Pajarito St
- 1839 N San Carlos Loop
- 1827 N San Carlos Loop
- 1823 N San Carlos Loop
- 1835 N San Carlos Loop
- 1819 N San Carlos Loop
- 1812 N San Carlos Loop
- 1813 N San Simon Dr
- 1809 N San Simon Dr
- 1804 N San Carlos Loop
- 1805 N San Simon Dr
- 1790 N San Carlos Loop
- 1791 N San Simon Dr
- 0 N San Simon Dr Unit 4109185
- 1787 N San Simon Dr
- 1766 N San Carlos Loop
- 1808 N San Carlos Loop
- 1786 N San Carlos Loop
- 1786 N San Carlos Loop
- 1782 N San Carlos Loop
- 1783 N San Simon Dr