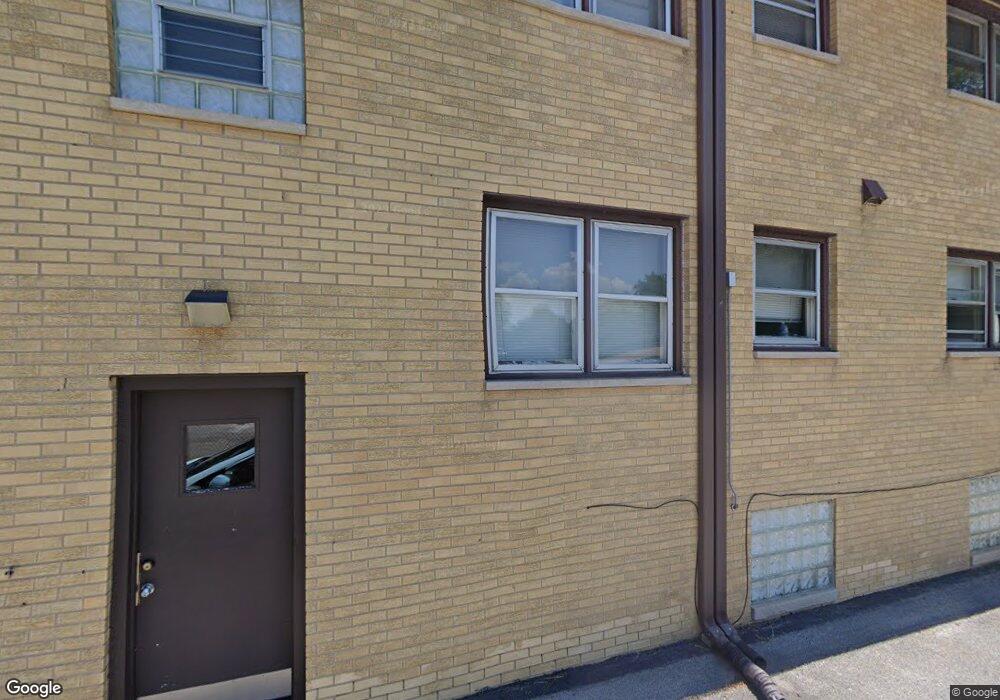
18318 Exchange Ave Unit 1F Lansing, IL 60438
Estimated Value: $69,202 - $102,000
1
Bed
1
Bath
630
Sq Ft
$140/Sq Ft
Est. Value
About This Home
This home is located at 18318 Exchange Ave Unit 1F, Lansing, IL 60438 and is currently estimated at $88,301, approximately $140 per square foot. 18318 Exchange Ave Unit 1F is a home located in Cook County with nearby schools including Oak Glen Elementary School, Memorial Jr High School, and Thornton Fractnl So High School.
Ownership History
Date
Name
Owned For
Owner Type
Purchase Details
Closed on
Nov 25, 2013
Sold by
Baranowski Charmaine
Bought by
Baranowski Katie L
Current Estimated Value
Home Financials for this Owner
Home Financials are based on the most recent Mortgage that was taken out on this home.
Original Mortgage
$38,800
Outstanding Balance
$19,959
Interest Rate
4.17%
Mortgage Type
New Conventional
Estimated Equity
$68,342
Purchase Details
Closed on
Nov 14, 2003
Sold by
Roeda Betty Jane
Bought by
Mulder Sharon and Baranowski Charmaine
Purchase Details
Closed on
Sep 4, 2001
Sold by
Linos Garry
Bought by
Roeda Cornelius and Roeda Betty Jane
Purchase Details
Closed on
Feb 28, 2001
Sold by
Catlin Angeline J
Bought by
Linos Andrew
Home Financials for this Owner
Home Financials are based on the most recent Mortgage that was taken out on this home.
Original Mortgage
$16,000
Interest Rate
7.13%
Purchase Details
Closed on
Apr 28, 1997
Sold by
Stark Elsie C
Bought by
Catlin Angeline C
Create a Home Valuation Report for This Property
The Home Valuation Report is an in-depth analysis detailing your home's value as well as a comparison with similar homes in the area
Home Values in the Area
Average Home Value in this Area
Purchase History
| Date | Buyer | Sale Price | Title Company |
|---|---|---|---|
| Baranowski Katie L | $40,000 | Pntn | |
| Mulder Sharon | -- | -- | |
| Roeda Cornelius | $57,000 | -- | |
| Linos Andrew | $56,000 | -- | |
| Catlin Angeline C | $58,000 | -- |
Source: Public Records
Mortgage History
| Date | Status | Borrower | Loan Amount |
|---|---|---|---|
| Open | Baranowski Katie L | $38,800 | |
| Previous Owner | Linos Andrew | $16,000 |
Source: Public Records
Tax History Compared to Growth
Tax History
| Year | Tax Paid | Tax Assessment Tax Assessment Total Assessment is a certain percentage of the fair market value that is determined by local assessors to be the total taxable value of land and additions on the property. | Land | Improvement |
|---|---|---|---|---|
| 2024 | $1,811 | $7,060 | $865 | $6,195 |
| 2023 | $217 | $7,059 | $865 | $6,194 |
| 2022 | $217 | $3,756 | $763 | $2,993 |
| 2021 | $268 | $3,755 | $762 | $2,993 |
| 2020 | $383 | $3,755 | $762 | $2,993 |
| 2019 | $512 | $4,328 | $711 | $3,617 |
| 2018 | $499 | $4,328 | $711 | $3,617 |
| 2017 | $538 | $4,328 | $711 | $3,617 |
| 2016 | $1,115 | $4,536 | $661 | $3,875 |
| 2015 | $972 | $4,536 | $661 | $3,875 |
| 2014 | $986 | $4,536 | $661 | $3,875 |
| 2013 | $261 | $5,370 | $661 | $4,709 |
Source: Public Records
Map
Nearby Homes
- 18235 Exchange Ave
- 2643 Ridge Rd
- 18429 Arcadia Ave
- 18240 Wildwood Ave
- 2616 Ridge Rd
- 18559 Escanaba Ave Unit 305
- 2606 Ridge Rd
- 2715 Indiana Ave
- 18340 Glen Oak Ave Unit 1D
- 18340 Glen Oak Ave Unit 3C
- 18452 Oakwood Ave
- 18062 Exchange Ave
- 18518 Glen Oak Ave
- 18514 Ridgewood Ave
- 18136 Oakwood Ave
- 2914 Ridge Rd
- 18508 Torrence Ave
- 18101 Wildwood Ave
- 18550 Torrence Ave Unit 19
- 18550 Torrence Ave Unit 15
- 18318 Exchange Ave Unit 2A
- 18318 Exchange Ave Unit 1A
- 18318 Exchange Ave Unit 2D
- 18318 Exchange Ave Unit 2F
- 18318 Exchange Ave Unit 2C
- 18318 Exchange Ave Unit 2B
- 18318 Exchange Ave Unit 1E
- 18318 Exchange Ave Unit 1D
- 18318 Exchange Ave Unit 1G
- 18318 Exchange Ave Unit 2E
- 18318 Exchange Ave Unit 1C
- 18306 Exchange Ave
- 18305 Exchange Ave Unit 5
- 18305 Exchange Ave Unit 12
- 18305 Exchange Ave
- 18258 Exchange Ave
- 18252 Exchange Ave
- 2619 183rd Place
- 18259 Exchange Ave
- 18335 Exchange Ave