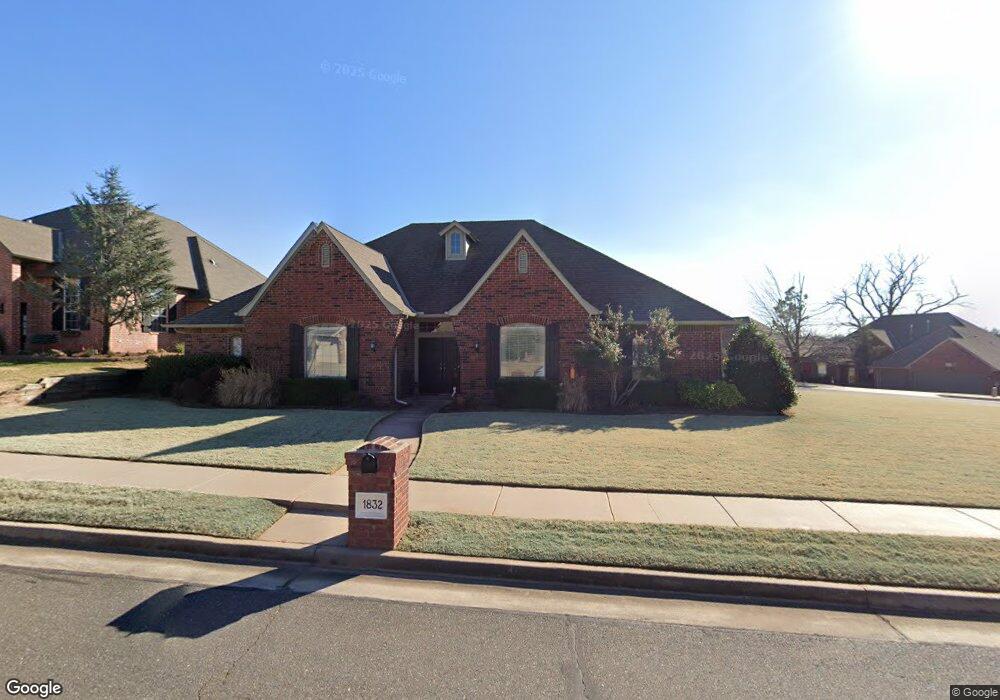
1832 Apache Trail Edmond, OK 73003
Thomas Trails NeighborhoodEstimated Value: $377,438 - $424,000
4
Beds
3
Baths
2,428
Sq Ft
$166/Sq Ft
Est. Value
About This Home
This home is located at 1832 Apache Trail, Edmond, OK 73003 and is currently estimated at $401,860, approximately $165 per square foot. 1832 Apache Trail is a home located in Oklahoma County with nearby schools including John Ross Elementary School, Cheyenne Middle School, and North High School.
Ownership History
Date
Name
Owned For
Owner Type
Purchase Details
Closed on
Feb 16, 2007
Sold by
Brooks Terry L and Brooks Carla J
Bought by
Avers Max and Avers Judy
Current Estimated Value
Purchase Details
Closed on
Jun 6, 2003
Sold by
Don Chesser Homes Inc
Bought by
Brooks Terry L and Brooks Carla J
Purchase Details
Closed on
Jun 4, 2003
Sold by
Don Chesser Homes Inc
Bought by
Pudjarminta Onky and Rahardjo Surjati
Purchase Details
Closed on
Oct 28, 2002
Sold by
Cheyenne Crossing Llc
Bought by
Don Chesser Homes Inc
Create a Home Valuation Report for This Property
The Home Valuation Report is an in-depth analysis detailing your home's value as well as a comparison with similar homes in the area
Home Values in the Area
Average Home Value in this Area
Purchase History
| Date | Buyer | Sale Price | Title Company |
|---|---|---|---|
| Avers Max | $252,500 | Stewart Abstract & Title Of | |
| Brooks Terry L | $239,500 | Stewart Abstract & Title | |
| Pudjarminta Onky | $208,000 | Stewart Abstract & Title | |
| Don Chesser Homes Inc | $34,000 | Stewart Abstract & Title |
Source: Public Records
Tax History
| Year | Tax Paid | Tax Assessment Tax Assessment Total Assessment is a certain percentage of the fair market value that is determined by local assessors to be the total taxable value of land and additions on the property. | Land | Improvement |
|---|---|---|---|---|
| 2025 | $3,315 | $32,559 | $5,710 | $26,849 |
| 2024 | $3,315 | $32,559 | $5,902 | $26,657 |
| 2023 | $3,290 | $32,558 | $6,182 | $26,376 |
| 2022 | $3,203 | $31,610 | $6,835 | $24,775 |
| 2021 | $3,092 | $30,690 | $7,717 | $22,973 |
| 2020 | $3,124 | $30,635 | $6,898 | $23,737 |
| 2019 | $3,045 | $29,755 | $6,898 | $22,857 |
| 2018 | $2,994 | $29,095 | $0 | $0 |
| 2017 | $3,020 | $29,479 | $6,898 | $22,581 |
| 2016 | $2,991 | $29,259 | $6,762 | $22,497 |
| 2015 | $3,040 | $29,761 | $6,740 | $23,021 |
| 2014 | $2,945 | $28,894 | $6,762 | $22,132 |
Source: Public Records
Map
Nearby Homes
- 1909 Del Simmons Dr
- 2112 Willow Bend Dr
- 1801 Del Simmons Dr
- 1433 Glenolde Place
- 2214 Cedar Pointe Cir
- 2012 Cedar Meadow Ln
- 1300 Glenmere Ct
- 1721 Fawn Valley Ln
- 1812 Dena Dr
- 1409 Brayhill Rd
- 1908 Raquel Rd
- 2909 N Santa fe Ave
- 2605 Oakcrest Dr
- 2324 Merlot Ct
- 2601 Semillon Way
- 2016 Kendal Ct
- 1508 George St
- 1813 Victoria Dr
- 2708 Durland Dr
- 1401 Autumn Creek Dr
- 1824 Apache Trail
- 1817 Indian Springs Dr
- 1816 Apache Trail
- 1833 Apache Trail
- 2509 Flint Ridge Rd
- 1825 Apache Trail
- 2517 Flint Ridge Rd
- 2501 Flint Ridge Rd
- 1901 Apache Trail
- 1817 Apache Trail
- 1809 Indian Springs Dr
- 2441 Flint Ridge Rd
- 2525 Flint Ridge Rd
- 1808 Apache Trail
- 1809 Apache Trail
- 1832 Redland Dr
- 2433 Flint Ridge Rd
- 1801 Indian Springs Dr
- 1840 Redland Dr
- 1824 Redland Dr
Your Personal Tour Guide
Ask me questions while you tour the home.