Estimated Value: $289,000 - $549,000
3
Beds
3
Baths
2,066
Sq Ft
$195/Sq Ft
Est. Value
About This Home
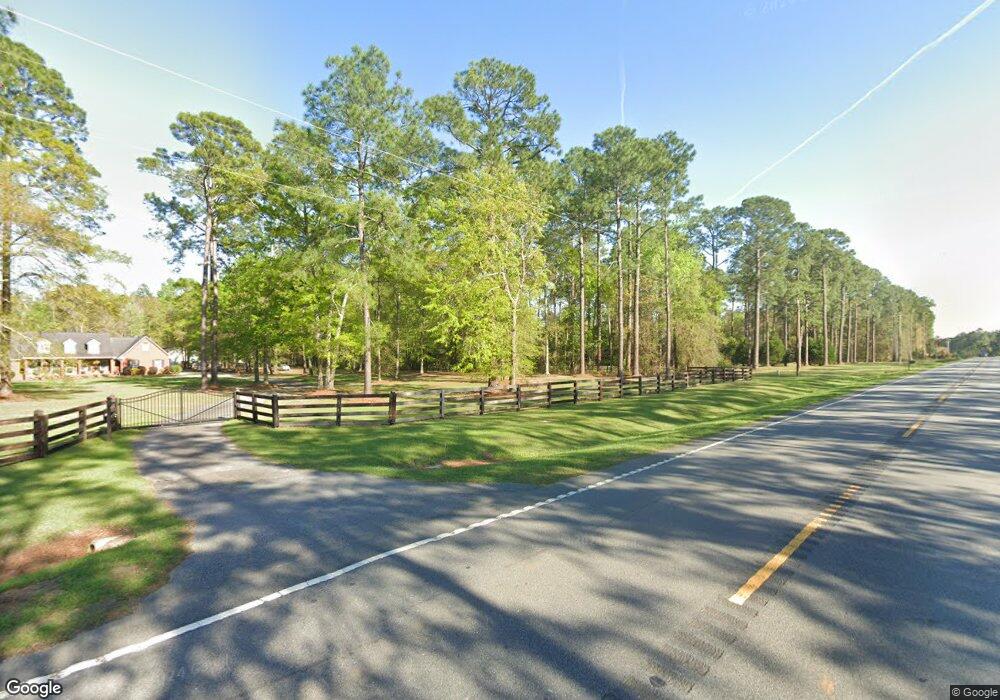
This home is located at 1832 Ga Highway 112 N, Cairo, GA 39827 and is currently estimated at $403,285, approximately $195 per square foot. 1832 Ga Highway 112 N is a home located in Grady County.
Ownership History
Date
Name
Owned For
Owner Type
Purchase Details
Closed on
May 23, 2017
Sold by
Barrett Christopher D
Bought by
Jeg Farms Llc
Current Estimated Value
Purchase Details
Closed on
Feb 17, 2015
Sold by
Bank Of The Ozarks
Bought by
Barrett Christopher D and Barrett Jenna N
Home Financials for this Owner
Home Financials are based on the most recent Mortgage that was taken out on this home.
Original Mortgage
$105,000
Interest Rate
3.74%
Mortgage Type
New Conventional
Purchase Details
Closed on
Dec 2, 2014
Sold by
Bass J William
Bought by
Bank Of The Ozarks
Purchase Details
Closed on
May 5, 2008
Sold by
Fralick Alfred N
Bought by
Bass Williamj
Home Financials for this Owner
Home Financials are based on the most recent Mortgage that was taken out on this home.
Original Mortgage
$13,735
Interest Rate
6.12%
Mortgage Type
New Conventional
Purchase Details
Closed on
Mar 30, 2005
Sold by
Stewart Michael Trent
Bought by
Fralick Alfred N
Purchase Details
Closed on
Oct 17, 1995
Bought by
Stewart Michael Trent
Create a Home Valuation Report for This Property
The Home Valuation Report is an in-depth analysis detailing your home's value as well as a comparison with similar homes in the area
Home Values in the Area
Average Home Value in this Area
Purchase History
| Date | Buyer | Sale Price | Title Company |
|---|---|---|---|
| Jeg Farms Llc | $280,000 | -- | |
| Barrett Christopher D | $144,000 | -- | |
| Bank Of The Ozarks | $135,800 | -- | |
| Bass Williamj | $300,000 | -- | |
| Fralick Alfred N | $239,000 | -- | |
| Stewart Michael Trent | $13,300 | -- |
Source: Public Records
Mortgage History
| Date | Status | Borrower | Loan Amount |
|---|---|---|---|
| Previous Owner | Barrett Christopher D | $105,000 | |
| Previous Owner | Bass Williamj | $13,735 |
Source: Public Records
Tax History Compared to Growth
Tax History
| Year | Tax Paid | Tax Assessment Tax Assessment Total Assessment is a certain percentage of the fair market value that is determined by local assessors to be the total taxable value of land and additions on the property. | Land | Improvement |
|---|---|---|---|---|
| 2024 | $3,930 | $129,736 | $10,920 | $118,816 |
| 2023 | $2,868 | $95,178 | $7,620 | $87,558 |
| 2022 | $2,868 | $95,178 | $7,620 | $87,558 |
| 2021 | $2,878 | $95,178 | $7,620 | $87,558 |
| 2020 | $2,888 | $95,178 | $7,620 | $87,558 |
| 2019 | $2,888 | $95,178 | $7,620 | $87,558 |
| 2018 | $2,540 | $89,307 | $7,620 | $81,687 |
| 2017 | $2,473 | $89,307 | $7,620 | $81,687 |
| 2016 | $2,139 | $76,786 | $7,620 | $69,166 |
| 2015 | $2,113 | $76,786 | $7,620 | $69,166 |
| 2014 | $2,855 | $76,786 | $7,620 | $69,166 |
| 2013 | -- | $101,236 | $7,818 | $93,418 |
Source: Public Records
Map
Nearby Homes
- 1741 Georgia 112
- 53 +/- A Bond Rd
- 189 Sabino Dr
- 231 Mcintyre Ln
- 264 Woodridge Ln
- 158 Woodridge Ln
- 1520 Upper Hawthorne Trail
- 105 Woodridge Ln
- 1725 Tract 2 Hwy 84w
- 1725 Tract #1 Hwy 84w
- 0 Upper Hawthorne Trail
- Lot 1 Crine Blvd
- 1500 15th Ave NW
- 1137 Summerfield
- 1389 Lake Front Dr
- 1200 15th Ave NW
- 1490 Magnolia Dr
- 1296 McQuaig St NW
- 000 15th Ave Nw -- Tract 1
- 000 15th Ave Nw -- Tract 2
- 1810 Ga Highway 112 N
- 1850 Ga Highway 112 N
- 1790 Ga Highway 112 N
- 1886 Ga Highway 112 N
- 1886 Ga Highway 112 N Unit 1
- 1842 Ga Highway 112 N
- 1842 Ga Highway 112 N
- 1888 Ga Highway 112 N
- 1754 Ga Highway 112 N
- 1754 Georgia 112
- 1910 Ga Highway 112 N
- 1900 Ga Highway 112 N
- 1714 Ga Highway 112 N
- 1924 Ga Highway 112 N
- 1920 Ga Highway 112 N
- 1974 Ga Highway 112 N
- 1974 Ga Highway 112 N
- 1961 Ga Highway 112 N
- 175 Gainous Ln
- 1741 Ga Highway 112 N