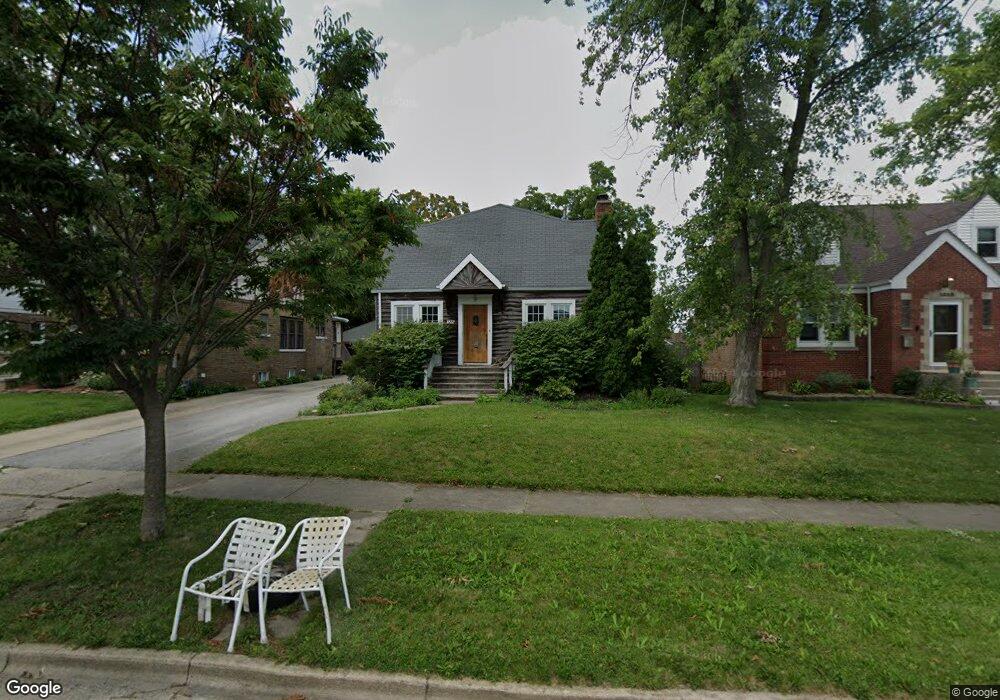
1832 Olive Rd Homewood, IL 60430
Estimated Value: $315,000 - $393,000
4
Beds
2
Baths
2,061
Sq Ft
$164/Sq Ft
Est. Value
About This Home
This home is located at 1832 Olive Rd, Homewood, IL 60430 and is currently estimated at $338,049, approximately $164 per square foot. 1832 Olive Rd is a home located in Cook County with nearby schools including Willow Elementary School, Winston Churchill School, and James Hart School.
Ownership History
Date
Name
Owned For
Owner Type
Purchase Details
Closed on
Feb 16, 2022
Sold by
Gruberman Garrett
Bought by
Nielsen Erika and Rasmussen Linda
Current Estimated Value
Purchase Details
Closed on
Feb 28, 2011
Sold by
The Charles Gruberman Revocable Trust
Bought by
Gruberman Charles and Gruberman Joyce
Purchase Details
Closed on
Jan 14, 2011
Sold by
Nielsen Erika R
Bought by
Gruberman Garrett
Purchase Details
Closed on
Jan 1, 2010
Sold by
Gruberman Charles and Gruberman Joyce
Bought by
Gruberman Garrett and Nielsen Erika R
Purchase Details
Closed on
May 5, 2008
Sold by
Gruberman Charles and Gruberman Joyce
Bought by
The Charles Gruberman Revocable Trust
Purchase Details
Closed on
May 31, 2007
Sold by
Fisher Michael J and Fisher Teresa M
Bought by
Gruberman Charles and Gruberman Joyce
Create a Home Valuation Report for This Property
The Home Valuation Report is an in-depth analysis detailing your home's value as well as a comparison with similar homes in the area
Home Values in the Area
Average Home Value in this Area
Purchase History
| Date | Buyer | Sale Price | Title Company |
|---|---|---|---|
| Nielsen Erika | -- | Chicago Title | |
| Gruberman Charles | -- | None Available | |
| Gruberman Garrett | -- | None Available | |
| Gruberman Garrett | -- | None Available | |
| Gruberman Garrett | $189,000 | None Available | |
| The Charles Gruberman Revocable Trust | -- | None Available | |
| Gruberman Charles | $234,000 | Multiple |
Source: Public Records
Tax History Compared to Growth
Tax History
| Year | Tax Paid | Tax Assessment Tax Assessment Total Assessment is a certain percentage of the fair market value that is determined by local assessors to be the total taxable value of land and additions on the property. | Land | Improvement |
|---|---|---|---|---|
| 2024 | $11,007 | $29,000 | $2,760 | $26,240 |
| 2023 | $6,412 | $29,000 | $2,760 | $26,240 |
| 2022 | $6,412 | $15,373 | $2,760 | $12,613 |
| 2021 | $6,024 | $15,373 | $2,760 | $12,613 |
| 2020 | $5,942 | $15,373 | $2,760 | $12,613 |
| 2019 | $6,737 | $16,848 | $2,587 | $14,261 |
| 2018 | $6,518 | $16,848 | $2,587 | $14,261 |
| 2017 | $6,555 | $16,848 | $2,587 | $14,261 |
| 2016 | $5,962 | $14,505 | $2,415 | $12,090 |
| 2015 | $5,844 | $14,505 | $2,415 | $12,090 |
| 2014 | $5,760 | $14,505 | $2,415 | $12,090 |
| 2013 | $5,406 | $14,828 | $2,415 | $12,413 |
Source: Public Records
Map
Nearby Homes
- 1852 Sycamore Rd
- 18241 Gottschalk Ave
- 1728 Olive Rd
- 1750 183rd St
- 1940 183rd St Unit 1C
- 1940 183rd St Unit 1D
- 1741 Evergreen Rd
- 18137 Martin Ave Unit 1NE
- 1655 183rd St
- 1617 183rd St
- 1554 Olive Rd
- 17919 Homewood Ave
- 1607 183rd St
- 18521 Homewood Ave
- 18462 Dixie Hwy
- 1758 Pine Rd
- 18104 Park Ave
- 1850 Pine Rd
- 1624 Burr Oak Rd
- 18521 Highland Ave
- 1836 Olive Rd
- 1828 Olive Rd
- 1842 Olive Rd
- 1824 Olive Rd
- 1833 Sycamore Rd
- 1827 Sycamore Rd
- 1848 Olive Rd
- 1818 Olive Rd
- 1843 Sycamore Rd
- 1819 Sycamore Rd
- 1829 Olive Rd
- 1837 Olive Rd
- 1847 Sycamore Rd
- 1817 Sycamore Rd
- 1825 Olive Rd
- 1821 Olive Rd
- 1847 Olive Rd
- 18156 Highland Ave
- 1853 Sycamore Rd
- 18200 Highland Ave