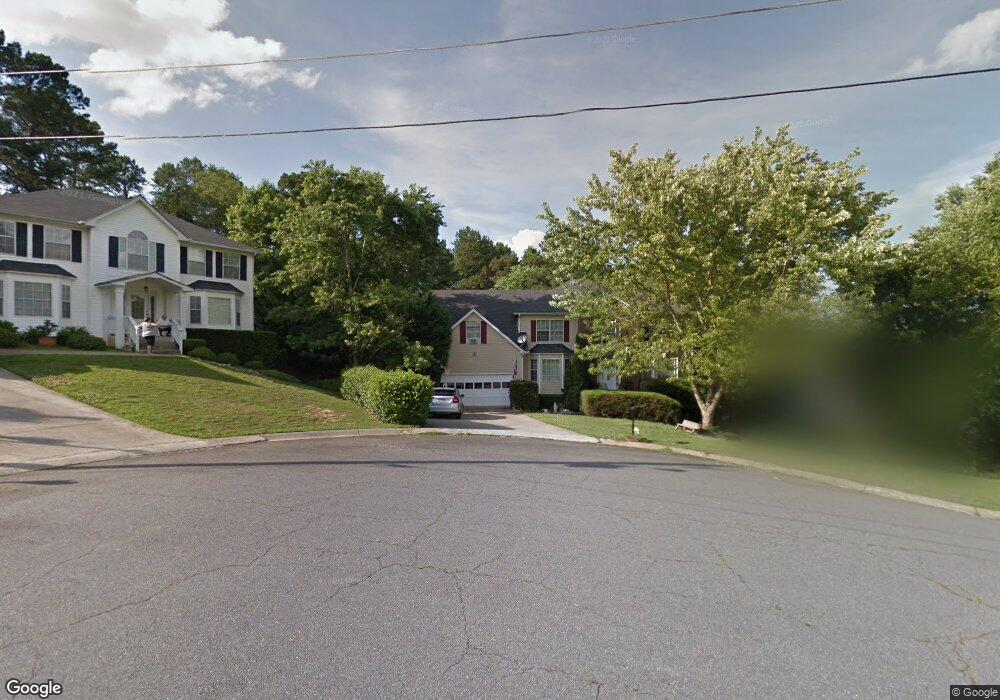
1832 Rocky Water Ct Unit 3 Buford, GA 30519
Estimated Value: $439,000 - $470,000
3
Beds
3
Baths
2,745
Sq Ft
$164/Sq Ft
Est. Value
About This Home
This home is located at 1832 Rocky Water Ct Unit 3, Buford, GA 30519 and is currently estimated at $449,747, approximately $163 per square foot. 1832 Rocky Water Ct Unit 3 is a home located in Gwinnett County with nearby schools including Woodward Mill Elementary School, Twin Rivers Middle School, and Mountain View High School.
Ownership History
Date
Name
Owned For
Owner Type
Purchase Details
Closed on
May 24, 2019
Sold by
Casas Pablo
Bought by
Perez Sergio
Current Estimated Value
Purchase Details
Closed on
May 29, 2001
Sold by
Debellis Syhirley A and Debellis Christopher
Bought by
Lane James R and Lane Deborah R
Home Financials for this Owner
Home Financials are based on the most recent Mortgage that was taken out on this home.
Original Mortgage
$165,200
Interest Rate
7.11%
Mortgage Type
New Conventional
Purchase Details
Closed on
Dec 22, 1993
Sold by
River Housing Group Inc
Bought by
Debillis Shirley A
Home Financials for this Owner
Home Financials are based on the most recent Mortgage that was taken out on this home.
Original Mortgage
$83,000
Interest Rate
7.19%
Create a Home Valuation Report for This Property
The Home Valuation Report is an in-depth analysis detailing your home's value as well as a comparison with similar homes in the area
Home Values in the Area
Average Home Value in this Area
Purchase History
| Date | Buyer | Sale Price | Title Company |
|---|---|---|---|
| Perez Sergio | -- | -- | |
| Lane James R | $173,900 | -- | |
| Debillis Shirley A | $125,700 | -- |
Source: Public Records
Mortgage History
| Date | Status | Borrower | Loan Amount |
|---|---|---|---|
| Previous Owner | Lane James R | $165,200 | |
| Previous Owner | Debillis Shirley A | $83,000 |
Source: Public Records
Tax History Compared to Growth
Tax History
| Year | Tax Paid | Tax Assessment Tax Assessment Total Assessment is a certain percentage of the fair market value that is determined by local assessors to be the total taxable value of land and additions on the property. | Land | Improvement |
|---|---|---|---|---|
| 2025 | $6,862 | $198,040 | $23,920 | $174,120 |
| 2024 | $6,935 | $183,680 | $28,000 | $155,680 |
| 2023 | $6,935 | $183,360 | $28,000 | $155,360 |
| 2022 | $4,938 | $128,160 | $16,000 | $112,160 |
| 2021 | $4,470 | $113,440 | $16,000 | $97,440 |
| 2020 | $4,496 | $113,440 | $16,000 | $97,440 |
| 2019 | $3,365 | $107,000 | $16,000 | $91,000 |
| 2018 | $3,249 | $101,480 | $16,000 | $85,480 |
| 2016 | $2,832 | $81,240 | $12,400 | $68,840 |
| 2015 | $2,605 | $69,880 | $8,400 | $61,480 |
| 2014 | $2,618 | $69,880 | $8,400 | $61,480 |
Source: Public Records
Map
Nearby Homes
- 1880 Rocksram Dr Unit 1
- 1935 Charleston Oak Cir
- 2375 Rock Springs Rd
- 2159 Sunny Hill Rd
- 2199 Sunny Hill Rd
- 2415 Mitchell Rd
- 1876 Hanover West Dr
- 2555 Rexs Place
- 1939 Sunny Hill Rd
- 2053 Arbor Springs Way
- The Colman Plan at The Beacon at Old Peachtree - Townhomes
- 2115 Sun Valley Ct
- 2066 Holland Creek Ct
- 2500 Sunny Hill Rd
- 2506 Sunny Hill Rd
- 1799 Braselton Hwy
- 2033 Jameson Cir
- 1798 Braselton Hwy
- 2016 Jameson Cir Unit 1
- 1943 Jameson Cir
- 1822 Rocky Water Ct
- 1852 Rocky Water Ct Unit 3
- 1812 Rocky Water Ct Unit 3
- 1855 Rocksram Dr Unit 1
- 1835 Rocksram Dr
- 1827 Rocky Water Ct
- 1865 Rocksram Dr
- 2352 Rocksram Ct Unit 6
- 2352 Rocksram Ct Unit 2352
- 2352 Rocksram Ct
- 1837 Rocky Water Ct
- 1825 Rocksram Dr
- 1857 Rocky Water Ct Unit 3
- 1847 Rocky Water Ct
- 1875 Rocksram Dr
- 1830 Rocksram Dr
- 1830 Rocksram Dr
- 1850 Rocksram Dr
- 2304 Rock Springs Rd
- 2357 Rocksram Ct