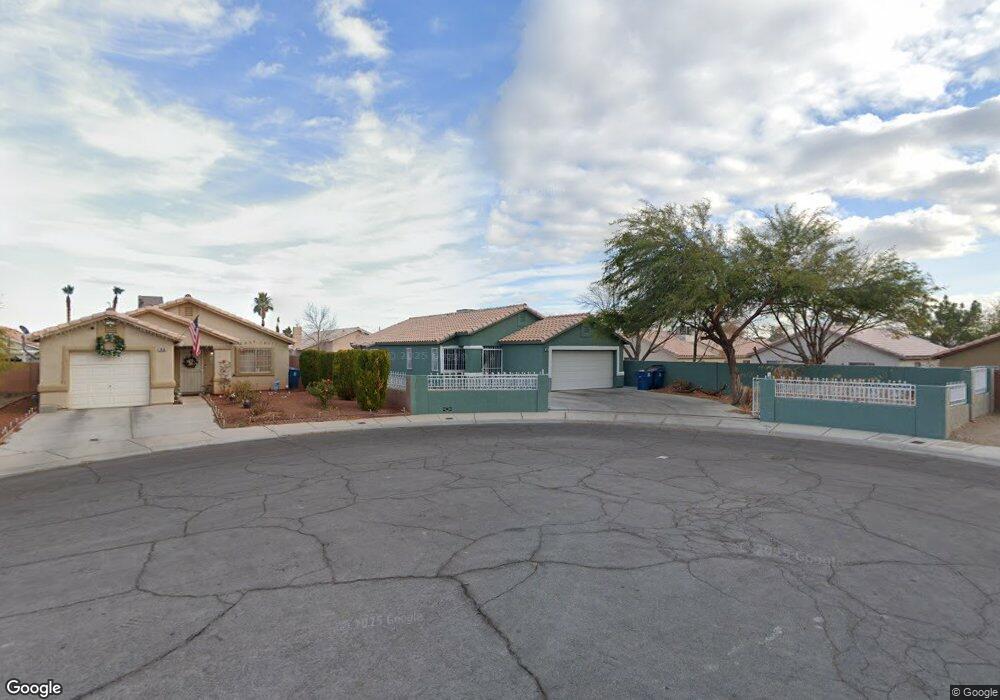
1832 Star Sapphire Ct Las Vegas, NV 89106
West Las Vegas NeighborhoodEstimated Value: $331,000 - $361,000
3
Beds
2
Baths
1,244
Sq Ft
$276/Sq Ft
Est. Value
About This Home
This home is located at 1832 Star Sapphire Ct, Las Vegas, NV 89106 and is currently estimated at $343,396, approximately $276 per square foot. 1832 Star Sapphire Ct is a home located in Clark County with nearby schools including Matt Kelly Elementary School, West Prepatory Academy At Charlles I West Hall Sec, and Western High School.
Ownership History
Date
Name
Owned For
Owner Type
Purchase Details
Closed on
Jan 29, 2008
Sold by
Sanchez Hector and Rodriguez Acela
Bought by
Sanchez Hector
Current Estimated Value
Home Financials for this Owner
Home Financials are based on the most recent Mortgage that was taken out on this home.
Original Mortgage
$180,000
Outstanding Balance
$113,717
Interest Rate
6.09%
Mortgage Type
New Conventional
Estimated Equity
$229,679
Purchase Details
Closed on
Jan 21, 1998
Sold by
Ldp Inc
Bought by
Sanchez Hector
Home Financials for this Owner
Home Financials are based on the most recent Mortgage that was taken out on this home.
Original Mortgage
$96,415
Interest Rate
7.13%
Purchase Details
Closed on
Jan 19, 1998
Sold by
Rodriguez Acela
Bought by
Sanchez Hector
Home Financials for this Owner
Home Financials are based on the most recent Mortgage that was taken out on this home.
Original Mortgage
$96,415
Interest Rate
7.13%
Create a Home Valuation Report for This Property
The Home Valuation Report is an in-depth analysis detailing your home's value as well as a comparison with similar homes in the area
Home Values in the Area
Average Home Value in this Area
Purchase History
| Date | Buyer | Sale Price | Title Company |
|---|---|---|---|
| Sanchez Hector | -- | Fidelity National Title | |
| Sanchez Hector | $101,500 | Fidelity National Title | |
| Sanchez Hector | -- | Fidelity National Title |
Source: Public Records
Mortgage History
| Date | Status | Borrower | Loan Amount |
|---|---|---|---|
| Open | Sanchez Hector | $180,000 | |
| Closed | Sanchez Hector | $96,415 |
Source: Public Records
Tax History Compared to Growth
Tax History
| Year | Tax Paid | Tax Assessment Tax Assessment Total Assessment is a certain percentage of the fair market value that is determined by local assessors to be the total taxable value of land and additions on the property. | Land | Improvement |
|---|---|---|---|---|
| 2025 | $969 | $71,908 | $24,500 | $47,408 |
| 2024 | $941 | $71,908 | $24,500 | $47,408 |
| 2023 | $941 | $69,415 | $24,500 | $44,915 |
| 2022 | $914 | $61,409 | $20,300 | $41,109 |
| 2021 | $928 | $56,970 | $17,850 | $39,120 |
| 2020 | $858 | $56,404 | $17,500 | $38,904 |
| 2019 | $804 | $49,593 | $11,200 | $38,393 |
| 2018 | $768 | $46,734 | $9,800 | $36,934 |
| 2017 | $1,512 | $46,134 | $8,750 | $37,384 |
| 2016 | $720 | $39,437 | $5,950 | $33,487 |
| 2015 | $717 | $26,529 | $4,200 | $22,329 |
| 2014 | $696 | $24,981 | $3,080 | $21,901 |
Source: Public Records
Map
Nearby Homes
- 2100 Port Ave
- 1918 King Hill St
- 1928 King Hill St
- 1936 King Hill St
- 2304 Shady Hill Ave
- 1901 Manhattan Dr
- 1908 Hart Ave
- 1904 Hart Ave
- 1310 N Tonopah Dr
- 1604 Luning Dr
- 2203 Langdon Way
- 1401 Mezpah Dr
- 2508 Ellingson Dr
- 2501 Charleville Ave Unit 104
- 2109 Jesse Scott St
- 2525 Sierra Bello Ave Unit 103
- 1956 Vista Malaga St Unit 103
- 1936 Lawry Ave
- 1932 Lawry Ave
- 1920 Hodgenville St Unit 103
- 1836 Star Sapphire Ct
- 2000 Emerald Green Ave
- 2008 Emerald Green Ave
- 1840 Star Sapphire Ct
- 1960 Emerald Green Ave
- 2012 Emerald Green Ave
- 1837 Pearl Hatpin Ct
- 1833 Pearl Hatpin Ct
- 1956 Emerald Green Ave Unit 3
- 1844 Star Sapphire Ct
- 2016 Emerald Green Ave
- 1841 Pearl Hatpin Ct
- 1833 Star Sapphire Ct
- 1952 Emerald Green Ave
- 1837 Star Sapphire Ct
- 1845 Pearl Hatpin Ct
- 1848 Star Sapphire Ct
- 2020 Emerald Green Ave
- 1841 Star Sapphire Ct
- 1948 Emerald Green Ave