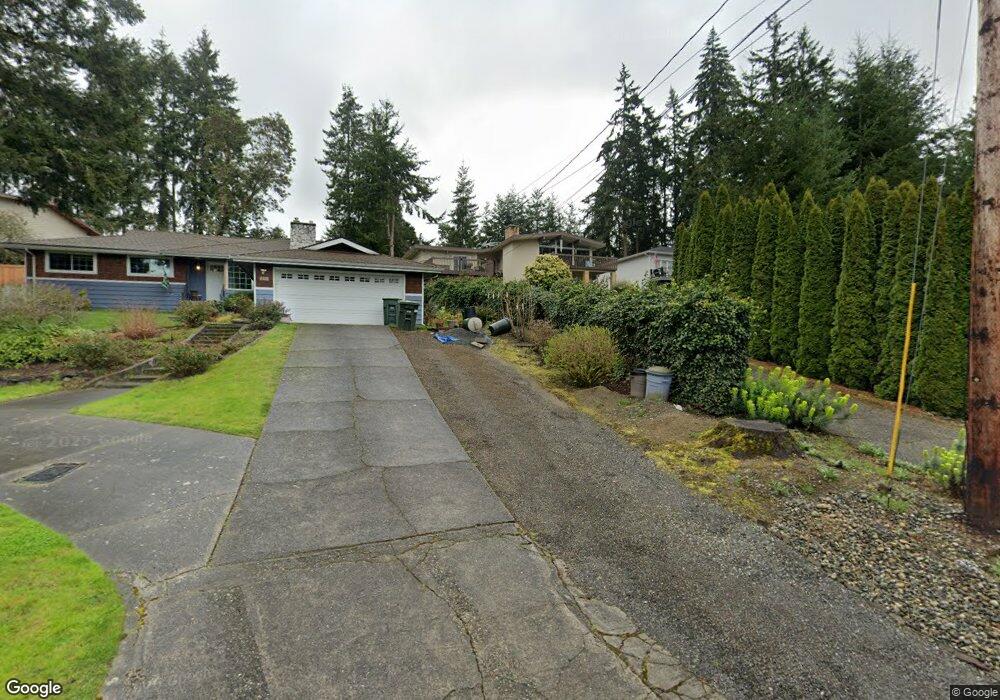
18323 Homeview Dr Edmonds, WA 98026
Lynndale - Blue Ridge NeighborhoodEstimated Value: $1,101,000 - $1,210,000
4
Beds
3
Baths
3,940
Sq Ft
$297/Sq Ft
Est. Value
About This Home
This home is located at 18323 Homeview Dr, Edmonds, WA 98026 and is currently estimated at $1,168,275, approximately $296 per square foot. 18323 Homeview Dr is a home located in Snohomish County with nearby schools including Seaview Elementary School, Meadowdale Middle School, and Meadowdale High School.
Ownership History
Date
Name
Owned For
Owner Type
Purchase Details
Closed on
Aug 21, 2008
Sold by
Brown Charles L and Brown Mary L
Bought by
Kumasaka Kyle J and Kumasaka Debra K
Current Estimated Value
Home Financials for this Owner
Home Financials are based on the most recent Mortgage that was taken out on this home.
Original Mortgage
$404,400
Outstanding Balance
$264,636
Interest Rate
6.27%
Mortgage Type
Unknown
Estimated Equity
$903,639
Purchase Details
Closed on
Apr 16, 2007
Sold by
Hertzog Sherlene M
Bought by
Brown Charles L and Brown Mary L
Home Financials for this Owner
Home Financials are based on the most recent Mortgage that was taken out on this home.
Original Mortgage
$369,600
Interest Rate
6.1%
Mortgage Type
New Conventional
Create a Home Valuation Report for This Property
The Home Valuation Report is an in-depth analysis detailing your home's value as well as a comparison with similar homes in the area
Home Values in the Area
Average Home Value in this Area
Purchase History
| Date | Buyer | Sale Price | Title Company |
|---|---|---|---|
| Kumasaka Kyle J | $516,000 | Northpoint Escrow & Title Ll | |
| Brown Charles L | $462,000 | Ticor Title |
Source: Public Records
Mortgage History
| Date | Status | Borrower | Loan Amount |
|---|---|---|---|
| Open | Kumasaka Kyle J | $404,400 | |
| Previous Owner | Brown Charles L | $369,600 |
Source: Public Records
Tax History
| Year | Tax Paid | Tax Assessment Tax Assessment Total Assessment is a certain percentage of the fair market value that is determined by local assessors to be the total taxable value of land and additions on the property. | Land | Improvement |
|---|---|---|---|---|
| 2025 | $6,458 | $934,100 | $546,000 | $388,100 |
| 2024 | $6,458 | $915,100 | $527,000 | $388,100 |
| 2023 | $6,474 | $950,600 | $496,000 | $454,600 |
| 2022 | $6,294 | $760,100 | $377,000 | $383,100 |
| 2020 | $6,427 | $692,000 | $356,000 | $336,000 |
| 2019 | $6,015 | $652,700 | $323,000 | $329,700 |
| 2018 | $6,082 | $570,200 | $275,000 | $295,200 |
| 2017 | $5,153 | $506,000 | $234,000 | $272,000 |
| 2016 | $4,779 | $471,600 | $207,000 | $264,600 |
Source: Public Records
Map
Nearby Homes
- 157 xx 72nd Ave W
- 7211 182nd St SW
- 18757 76th Ave W
- 17926 73rd Ave W
- 7416 176th St SW
- 7210 173rd St SW
- 7819 175th St SW
- 6830 Meadowdale Beach Rd
- 19412 68th Ave W
- 7929 Cyrus Place
- 7821 196th St SW Unit B
- 6406 191st St SW
- 8036 Cyrus Place
- 6112 188th St SW
- 18123 60th Ave W
- 8001 Talbot Rd
- 8718 189th Place SW
- 5838 186th Place SW
- 16858 76th Ave W
- 18710 88th Ave W
- 18325 Homeview Dr
- 18317 Homeview Dr
- 18401 Homeview Dr
- 18311 Homeview Dr
- 18403 74th Place W
- 18328 73rd Ave W
- 18320 73rd Ave W
- 18402 73rd Ave W
- 18312 73rd Ave W
- 18305 Homeview Dr
- 18411 74th Place W
- 18408 73rd Ave W
- 16 74th Place W
- 18306 73rd Ave W
- 18416 73rd Ave W
- 18301 Homeview Dr
- 18417 74th Place W
- 18320 Homeview Dr
- 18324 Homeview Dr
- 18421 Homeview Dr
Your Personal Tour Guide
Ask me questions while you tour the home.