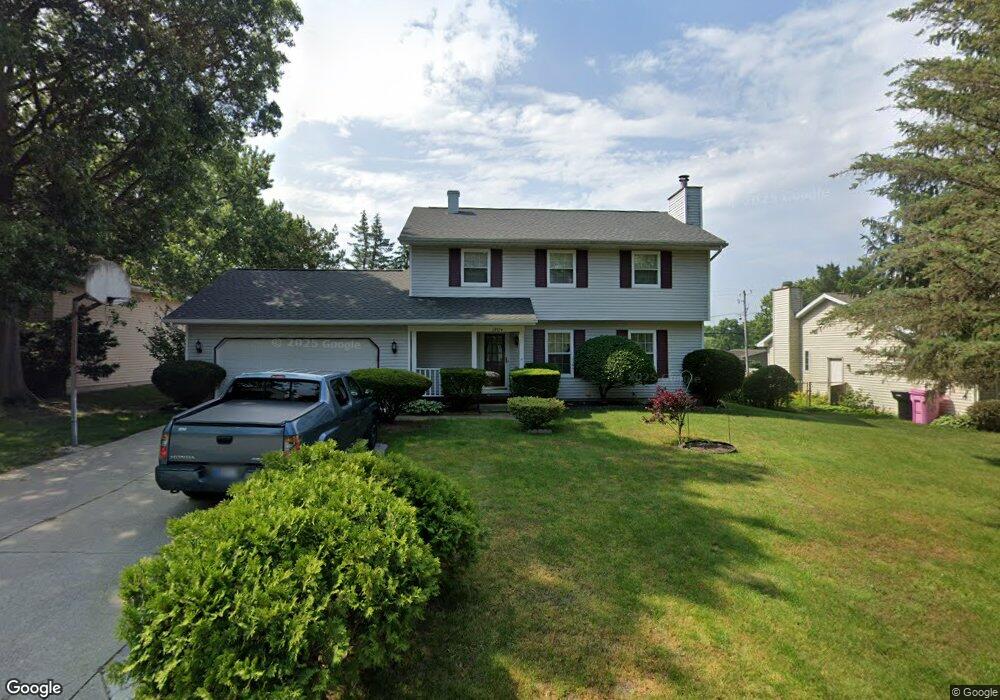
18324 Abbot Ct South Bend, IN 46637
Estimated Value: $277,181 - $285,000
4
Beds
3
Baths
1,683
Sq Ft
$166/Sq Ft
Est. Value
About This Home
This home is located at 18324 Abbot Ct, South Bend, IN 46637 and is currently estimated at $279,795, approximately $166 per square foot. 18324 Abbot Ct is a home located in St. Joseph County with nearby schools including Cora B. Darling Elementary School, Clay Intermediate Center, and Darden Elementary School.
Ownership History
Date
Name
Owned For
Owner Type
Purchase Details
Closed on
Jul 27, 2018
Sold by
Warren Robert and Warren Mollie
Bought by
Warren Robert
Current Estimated Value
Home Financials for this Owner
Home Financials are based on the most recent Mortgage that was taken out on this home.
Original Mortgage
$99,850
Outstanding Balance
$86,716
Interest Rate
4.5%
Mortgage Type
New Conventional
Estimated Equity
$193,079
Purchase Details
Closed on
Jul 20, 2018
Sold by
Warren Trust
Bought by
Warren Robert and Mollie P Warren
Home Financials for this Owner
Home Financials are based on the most recent Mortgage that was taken out on this home.
Original Mortgage
$99,850
Outstanding Balance
$86,716
Interest Rate
4.5%
Mortgage Type
New Conventional
Estimated Equity
$193,079
Purchase Details
Closed on
Jun 25, 2013
Sold by
Warren Robert and Warren Mollie P
Bought by
Warren Trust
Create a Home Valuation Report for This Property
The Home Valuation Report is an in-depth analysis detailing your home's value as well as a comparison with similar homes in the area
Home Values in the Area
Average Home Value in this Area
Purchase History
| Date | Buyer | Sale Price | Title Company |
|---|---|---|---|
| Warren Robert | -- | None Listed On Document | |
| Warren Robert | -- | None Listed On Document | |
| Warren Robert | -- | None Available | |
| Warren Trust | -- | None Available | |
| Warren Trust | -- | -- |
Source: Public Records
Mortgage History
| Date | Status | Borrower | Loan Amount |
|---|---|---|---|
| Open | Warren Robert | $99,850 | |
| Closed | Warren Robert | $99,850 |
Source: Public Records
Tax History Compared to Growth
Tax History
| Year | Tax Paid | Tax Assessment Tax Assessment Total Assessment is a certain percentage of the fair market value that is determined by local assessors to be the total taxable value of land and additions on the property. | Land | Improvement |
|---|---|---|---|---|
| 2024 | $1,941 | $245,300 | $55,000 | $190,300 |
| 2023 | $2,077 | $220,300 | $55,000 | $165,300 |
| 2022 | $2,117 | $217,400 | $55,000 | $162,400 |
| 2021 | $1,850 | $185,000 | $36,300 | $148,700 |
| 2020 | $1,787 | $180,300 | $34,600 | $145,700 |
| 2019 | $1,379 | $168,200 | $31,600 | $136,600 |
| 2018 | $1,279 | $154,600 | $29,000 | $125,600 |
| 2017 | $1,333 | $153,600 | $29,000 | $124,600 |
| 2016 | $1,227 | $144,700 | $29,000 | $115,700 |
| 2014 | $823 | $117,900 | $23,400 | $94,500 |
Source: Public Records
Map
Nearby Homes
- 52145 Brookview Ct
- 18391 Crownhill Dr
- 18268 Clairmont Dr
- 18330 Farm Ln
- 18193 Windmill Ct
- 18225 Amberly Ln
- TBD Emmons Rd
- 18268 Burton Dr
- 51824 Wembley Dr
- 51793 Heath Ct
- 18120 Chipstead Dr
- 52599 Emmons Rd
- 52625 Emmons Rd
- 52186 Woodridge Dr
- 52170 Woodridge Dr
- 52649 Emmons Rd
- 18918 Darden Rd
- 51680 Juniper Rd
- V/L Juniper Rd
- 52882 Camellia Dr
- 18340 Abbot Ct
- 18356 Abbot Ct
- 52239 Pickwick Ln
- 18343 Chaucer Ln
- 18323 Chaucer Ln
- 18325 Abbot Ct
- 18311 Abbot Ct
- 18339 Abbot Ct
- 18363 Chaucer Ln
- 18303 Chaucer Ln
- 52205 Pickwick Ln
- 18370 Abbot Ct
- 18385 Chaucer Ln
- 18322 Coventry Ct
- 18306 Coventry Ct
- 18371 Abbot Ct
- 18340 Coventry Ct
- 52177 Pickwick Ln
- 18386 Abbot Ct
- 52244 Pickwick Ln