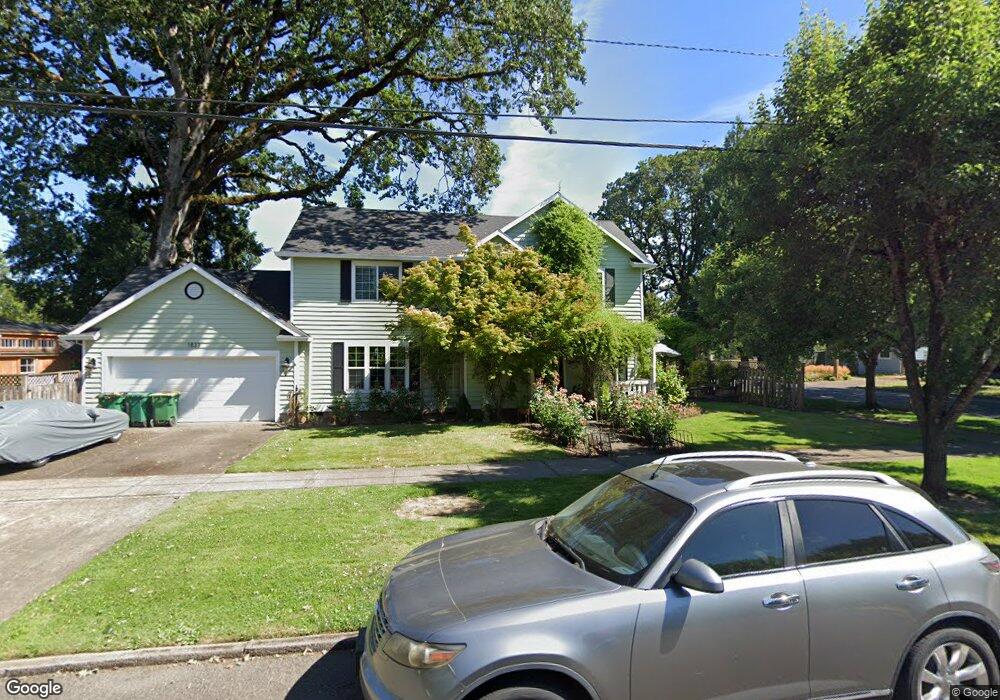
1833 17th Ave Forest Grove, OR 97116
Estimated Value: $518,000 - $654,000
3
Beds
7
Baths
1,840
Sq Ft
$309/Sq Ft
Est. Value
About This Home
This home is located at 1833 17th Ave, Forest Grove, OR 97116 and is currently estimated at $568,488, approximately $308 per square foot. 1833 17th Ave is a home located in Washington County with nearby schools including Joseph Gale Elementary School, Tom McCall Upper Elementary School, and Neil Armstrong Middle School.
Ownership History
Date
Name
Owned For
Owner Type
Purchase Details
Closed on
Jan 17, 2003
Sold by
Kalhar Terry L and Kalhar Patricia J
Bought by
Hofsted Michael J and Hofsted Dawn M
Current Estimated Value
Home Financials for this Owner
Home Financials are based on the most recent Mortgage that was taken out on this home.
Original Mortgage
$160,000
Outstanding Balance
$67,658
Interest Rate
6.15%
Estimated Equity
$500,830
Purchase Details
Closed on
Aug 8, 2001
Sold by
Evans Thomas and Evans Karen
Bought by
Turner Donald E and Turner Sharon
Create a Home Valuation Report for This Property
The Home Valuation Report is an in-depth analysis detailing your home's value as well as a comparison with similar homes in the area
Home Values in the Area
Average Home Value in this Area
Purchase History
| Date | Buyer | Sale Price | Title Company |
|---|---|---|---|
| Hofsted Michael J | $200,000 | Transnation Title Insurance | |
| Turner Donald E | -- | Oregon Title Insurance Co |
Source: Public Records
Mortgage History
| Date | Status | Borrower | Loan Amount |
|---|---|---|---|
| Open | Hofsted Michael J | $160,000 |
Source: Public Records
Tax History Compared to Growth
Tax History
| Year | Tax Paid | Tax Assessment Tax Assessment Total Assessment is a certain percentage of the fair market value that is determined by local assessors to be the total taxable value of land and additions on the property. | Land | Improvement |
|---|---|---|---|---|
| 2026 | $5,231 | $293,720 | -- | -- |
| 2025 | $5,231 | $285,170 | -- | -- |
| 2024 | $5,046 | $276,870 | -- | -- |
| 2023 | $5,046 | $268,810 | $0 | $0 |
| 2022 | $4,412 | $268,810 | $0 | $0 |
| 2021 | $4,355 | $253,390 | $0 | $0 |
| 2020 | $4,332 | $246,010 | $0 | $0 |
| 2019 | $4,235 | $238,850 | $0 | $0 |
| 2018 | $4,105 | $231,900 | $0 | $0 |
| 2017 | $3,978 | $225,150 | $0 | $0 |
| 2016 | $3,866 | $218,600 | $0 | $0 |
| 2015 | $3,718 | $212,240 | $0 | $0 |
| 2014 | $3,700 | $206,060 | $0 | $0 |
Source: Public Records
Map
Nearby Homes