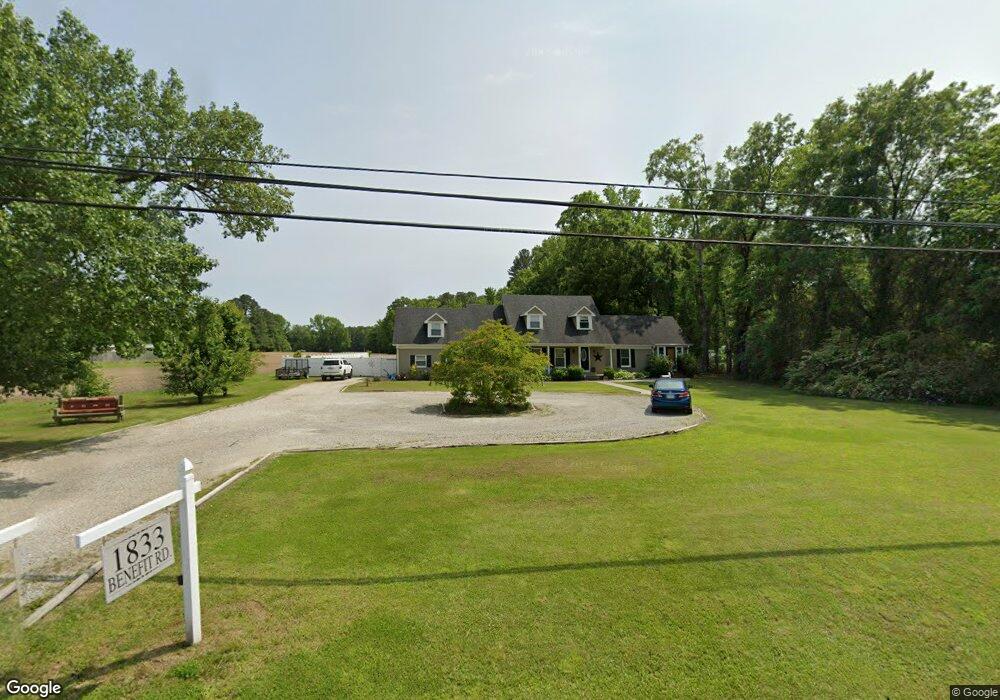
1833 Benefit Rd Chesapeake, VA 23322
Pleasant Grove West NeighborhoodEstimated Value: $558,000 - $731,000
5
Beds
4
Baths
3,110
Sq Ft
$211/Sq Ft
Est. Value
About This Home
This home is located at 1833 Benefit Rd, Chesapeake, VA 23322 and is currently estimated at $655,475, approximately $210 per square foot. 1833 Benefit Rd is a home located in Chesapeake City with nearby schools including Hickory Elementary School, Hickory Middle School, and Grassfield High School.
Ownership History
Date
Name
Owned For
Owner Type
Purchase Details
Closed on
Nov 16, 2016
Sold by
Mcelroy Jeremy R
Bought by
Mcelroy Jeremy R and Mcelroy Allison
Current Estimated Value
Home Financials for this Owner
Home Financials are based on the most recent Mortgage that was taken out on this home.
Original Mortgage
$382,000
Outstanding Balance
$308,458
Interest Rate
3.52%
Mortgage Type
New Conventional
Estimated Equity
$339,135
Purchase Details
Closed on
Mar 14, 2014
Sold by
Marscheider Properties Llc
Bought by
Mcelroy Jeremy R
Home Financials for this Owner
Home Financials are based on the most recent Mortgage that was taken out on this home.
Original Mortgage
$315,000
Interest Rate
4.32%
Mortgage Type
VA
Purchase Details
Closed on
Jul 18, 2012
Sold by
Hsbc Nabk Usa National Asson L
Bought by
Marscheider Properties Llc
Home Financials for this Owner
Home Financials are based on the most recent Mortgage that was taken out on this home.
Original Mortgage
$146,199
Interest Rate
3.7%
Mortgage Type
New Conventional
Create a Home Valuation Report for This Property
The Home Valuation Report is an in-depth analysis detailing your home's value as well as a comparison with similar homes in the area
Home Values in the Area
Average Home Value in this Area
Purchase History
| Date | Buyer | Sale Price | Title Company |
|---|---|---|---|
| Mcelroy Jeremy R | -- | None Available | |
| Mcelroy Jeremy R | $315,000 | -- | |
| Marscheider Properties Llc | $146,199 | -- |
Source: Public Records
Mortgage History
| Date | Status | Borrower | Loan Amount |
|---|---|---|---|
| Open | Mcelroy Jeremy R | $382,000 | |
| Closed | Mcelroy Jeremy R | $315,000 | |
| Previous Owner | Marscheider Properties Llc | $146,199 |
Source: Public Records
Tax History Compared to Growth
Tax History
| Year | Tax Paid | Tax Assessment Tax Assessment Total Assessment is a certain percentage of the fair market value that is determined by local assessors to be the total taxable value of land and additions on the property. | Land | Improvement |
|---|---|---|---|---|
| 2025 | $5,359 | $557,100 | $165,000 | $392,100 |
| 2024 | $5,359 | $530,600 | $145,000 | $385,600 |
| 2023 | $4,854 | $480,600 | $115,000 | $365,600 |
| 2022 | $4,396 | $435,200 | $105,000 | $330,200 |
| 2021 | $4,015 | $382,400 | $100,000 | $282,400 |
| 2020 | $3,858 | $367,400 | $100,000 | $267,400 |
| 2019 | $3,789 | $360,900 | $90,000 | $270,900 |
| 2018 | $3,654 | $348,000 | $90,000 | $258,000 |
| 2017 | $3,549 | $338,000 | $80,000 | $258,000 |
| 2016 | $3,222 | $306,900 | $80,000 | $226,900 |
| 2015 | $3,222 | $306,900 | $80,000 | $226,900 |
| 2014 | $3,222 | $306,900 | $80,000 | $226,900 |
Source: Public Records
Map
Nearby Homes
- 2321 Shillelagh Rd
- 55+AC Benefit Rd
- MM Willow
- MM Hungarian (Caroline Design) Rd
- MM Stoney Creek (Platinum 2)
- MM Capstone Stoney Creek
- MM Hungarian (Freemont On Lot 1) Rd
- 1254 Solitude Trail
- MM Capstone Gen Suite Stoney Creek
- MM Taft (Ambler Parcel A-4) Rd
- MM Taft (Campbell Homesite A-2) Rd
- MM MacOn-multi-gen In Stoney Creek
- 912 Koonce Ln
- MM Taft (Squire Parcel A - 4) Rd
- 1263 Solitude Trail
- MM Legacy 4 Branch
- 420 Stoney Mist Way
- 104 Agave Ct
- 404 Stoney Mist Way
- MM Cornerstone 1 Acre
- 1821 Benefit Rd
- 1837 Benefit Rd
- 1849 Benefit Rd
- 1820 Benefit Rd
- 1817 Benefit Rd
- 1850 Benefit Rd
- 1816 Benefit Rd
- 1805 Benefit Rd
- 1905 Benefit Rd
- 1917 Benefit Rd
- 2532 Shillelagh Rd
- 2480 Shillelagh Rd
- 1745 Benefit Rd
- 1908 Benefit Rd
- 2512 Shillelagh Rd
- 2516 Shillelagh Rd
- 1925 Benefit Rd
- 1920 Benefit Rd
- 1737 Benefit Rd
- 1733 Benefit Rd