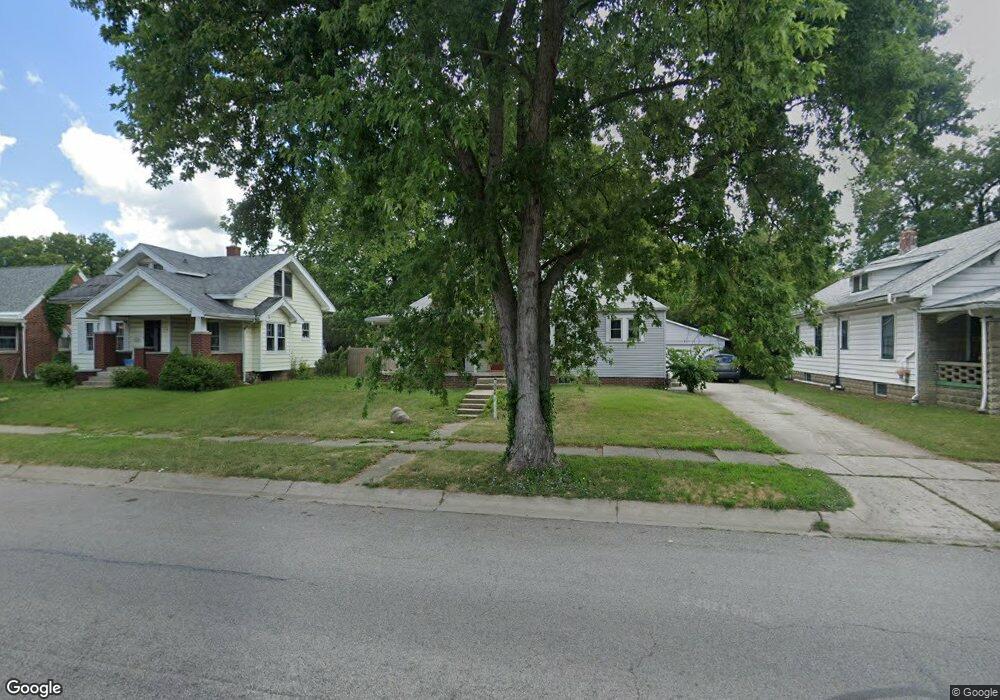
1833 N 15th St Lafayette, IN 47904
Saint Lawrence McAllister NeighborhoodEstimated Value: $173,000 - $203,000
3
Beds
2
Baths
976
Sq Ft
$192/Sq Ft
Est. Value
About This Home
This home is located at 1833 N 15th St, Lafayette, IN 47904 and is currently estimated at $186,996, approximately $191 per square foot. 1833 N 15th St is a home located in Tippecanoe County with nearby schools including Vinton Elementary School, Sunnyside Intermediate School, and Lafayette Tecumseh Junior High School.
Ownership History
Date
Name
Owned For
Owner Type
Purchase Details
Closed on
Mar 19, 2010
Sold by
Wells Fargo Bank N A
Bought by
Hamm Corey N and Abston Samantha R
Current Estimated Value
Home Financials for this Owner
Home Financials are based on the most recent Mortgage that was taken out on this home.
Original Mortgage
$63,524
Outstanding Balance
$42,165
Interest Rate
5.01%
Mortgage Type
FHA
Estimated Equity
$144,831
Purchase Details
Closed on
Aug 11, 2009
Sold by
Ward Vickie D
Bought by
Wells Fargo Bank Na
Purchase Details
Closed on
Dec 18, 2000
Sold by
Bower James M and Bower Pamela J
Bought by
Ward Vickie D
Home Financials for this Owner
Home Financials are based on the most recent Mortgage that was taken out on this home.
Original Mortgage
$84,850
Interest Rate
7.77%
Mortgage Type
FHA
Create a Home Valuation Report for This Property
The Home Valuation Report is an in-depth analysis detailing your home's value as well as a comparison with similar homes in the area
Home Values in the Area
Average Home Value in this Area
Purchase History
| Date | Buyer | Sale Price | Title Company |
|---|---|---|---|
| Hamm Corey N | -- | Lawyers Title Insurance Corp | |
| Wells Fargo Bank Na | $66,300 | None Available | |
| Ward Vickie D | -- | -- |
Source: Public Records
Mortgage History
| Date | Status | Borrower | Loan Amount |
|---|---|---|---|
| Open | Hamm Corey N | $63,524 | |
| Previous Owner | Ward Vickie D | $84,850 |
Source: Public Records
Tax History Compared to Growth
Tax History
| Year | Tax Paid | Tax Assessment Tax Assessment Total Assessment is a certain percentage of the fair market value that is determined by local assessors to be the total taxable value of land and additions on the property. | Land | Improvement |
|---|---|---|---|---|
| 2024 | $1,122 | $135,100 | $16,300 | $118,800 |
| 2023 | $1,014 | $127,000 | $16,300 | $110,700 |
| 2022 | $963 | $108,700 | $16,300 | $92,400 |
| 2021 | $732 | $91,900 | $16,300 | $75,600 |
| 2020 | $566 | $82,300 | $16,300 | $66,000 |
| 2019 | $634 | $87,200 | $24,000 | $63,200 |
| 2018 | $585 | $83,800 | $24,000 | $59,800 |
| 2017 | $567 | $83,100 | $24,000 | $59,100 |
| 2016 | $514 | $80,400 | $24,000 | $56,400 |
| 2014 | $491 | $79,500 | $24,000 | $55,500 |
| 2013 | $500 | $80,600 | $24,000 | $56,600 |
Source: Public Records
Map
Nearby Homes
- 1831 N 13th St
- 108 Barbee St
- 1430 N 16th St
- 1411 N 14th St
- 2215 N 18th St
- 1904 Greenbush St
- 1925 Maple St
- 1803 Pierce St
- 1931 Morton St
- 2022 Elk St
- 2127 Perrine St
- 2340 N 20th St
- 2001 Schuyler Ave
- 1000 Hartford St
- 2226 N 23rd St
- 1729 Arlington Rd
- 2211 N 24th St
- 2101 Monon Ave
- 2107 Monon Ave
- 802 Tippecanoe St
- 1827 N 15th St
- 1839 N 15th St
- 1823 N 15th St
- 1843 N 15th St
- 1828 N 16th St
- 1845 N 15th St
- 1817 N 15th St
- 1826 N 16th St
- 1832 N 16th St
- 1824 N 16th St
- 1813 N 15th St
- 1836 N 15th St
- 1840 N 15th St
- 1844 N 15th St
- 1836 N 16th St
- 1818 N 16th St
- 1811 N 15th St
- 1816 N 15th St
- 1429 Hart St Unit 14
- 1901 N 15th St