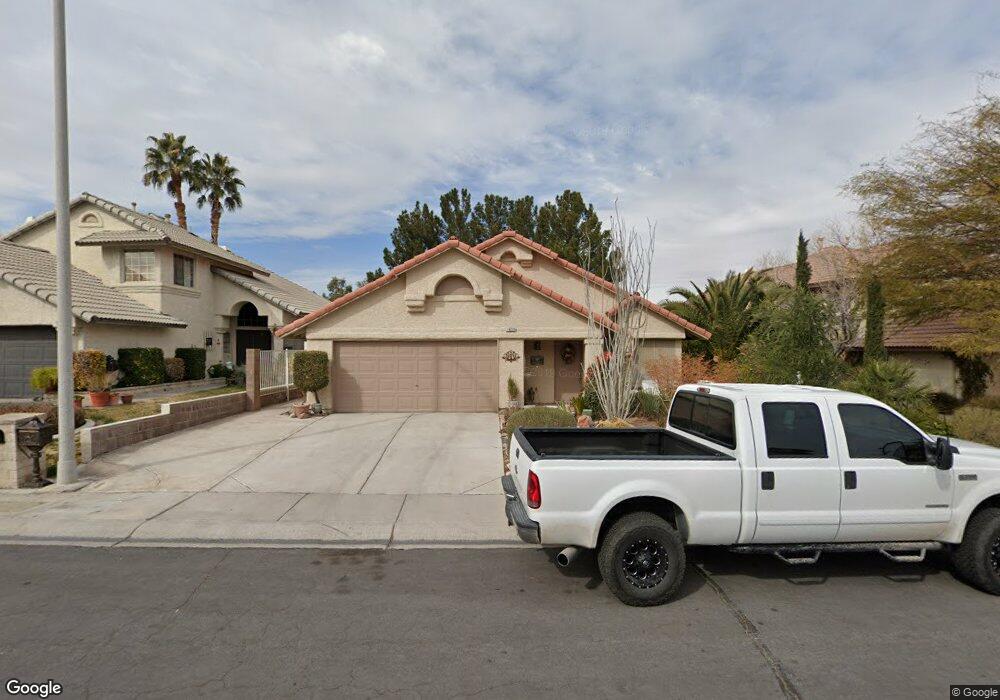
1833 Ruby Ln Unit 2 Henderson, NV 89014
Green Valley North NeighborhoodEstimated Value: $443,000 - $499,000
3
Beds
2
Baths
1,799
Sq Ft
$261/Sq Ft
Est. Value
About This Home
This home is located at 1833 Ruby Ln Unit 2, Henderson, NV 89014 and is currently estimated at $470,306, approximately $261 per square foot. 1833 Ruby Ln Unit 2 is a home located in Clark County with nearby schools including Estes M Mcdoniel Elementary School, Barbara and Hank Greenspun Junior High School, and Green Valley High School.
Ownership History
Date
Name
Owned For
Owner Type
Purchase Details
Closed on
Sep 22, 2022
Sold by
Richardson Ronald D
Bought by
Ronald D Richardson Living Trust
Current Estimated Value
Purchase Details
Closed on
Jun 27, 2011
Sold by
Mgmt Llc
Bought by
Richardson Ronald D and Nilsen Rex L
Purchase Details
Closed on
Apr 1, 2011
Sold by
Stuart Mary Kyle
Bought by
Mgmt Llc
Purchase Details
Closed on
Feb 8, 1996
Sold by
Forrester Charles Ed and Forrester Gillian M
Bought by
Stuart Mary Kyle
Home Financials for this Owner
Home Financials are based on the most recent Mortgage that was taken out on this home.
Original Mortgage
$111,000
Interest Rate
7.14%
Create a Home Valuation Report for This Property
The Home Valuation Report is an in-depth analysis detailing your home's value as well as a comparison with similar homes in the area
Home Values in the Area
Average Home Value in this Area
Purchase History
| Date | Buyer | Sale Price | Title Company |
|---|---|---|---|
| Ronald D Richardson Living Trust | -- | -- | |
| Richardson Ronald D | $145,000 | North American Title Sahara | |
| Mgmt Llc | $109,200 | None Available | |
| Stuart Mary Kyle | $143,000 | Nevada Title Company |
Source: Public Records
Mortgage History
| Date | Status | Borrower | Loan Amount |
|---|---|---|---|
| Previous Owner | Stuart Mary Kyle | $111,000 |
Source: Public Records
Tax History
| Year | Tax Paid | Tax Assessment Tax Assessment Total Assessment is a certain percentage of the fair market value that is determined by local assessors to be the total taxable value of land and additions on the property. | Land | Improvement |
|---|---|---|---|---|
| 2026 | $1,831 | $100,067 | $44,100 | $55,967 |
| 2025 | $1,778 | $109,230 | $51,450 | $57,780 |
| 2024 | $1,726 | $109,230 | $51,450 | $57,780 |
| 2023 | $1,726 | $95,191 | $39,900 | $55,291 |
| 2022 | $1,676 | $84,955 | $33,950 | $51,005 |
| 2021 | $1,627 | $80,452 | $31,500 | $48,952 |
| 2020 | $1,577 | $79,308 | $30,450 | $48,858 |
| 2019 | $1,531 | $74,395 | $25,900 | $48,495 |
| 2018 | $1,487 | $69,430 | $22,400 | $47,030 |
| 2017 | $2,041 | $70,416 | $22,400 | $48,016 |
| 2016 | $1,408 | $69,739 | $21,350 | $48,389 |
| 2015 | $1,405 | $47,761 | $12,250 | $35,511 |
| 2014 | $1,364 | $45,680 | $12,250 | $33,430 |
Source: Public Records
Map
Nearby Homes
- 1741 Saddleback Ct
- 405 Donner Pass Dr
- 1748 Stagecoach Dr
- 1908 Ginori Ct
- 1715 Empire Mine Dr
- 1826 Somersby Way
- 542 Cervantes Dr
- 2220 Marlboro Dr
- 509 Brightwater St
- 1658 Britannia Ave
- 363 El Pico Dr
- 393 Blanca Springs Dr
- 1807 Rapier Dr Unit 151
- 372 Rushing Creek Ct
- 390 Rosado Springs St
- 639 Pepper Tree Cir Unit A
- 2050 W Warm Springs Rd Unit 4323
- 2050 W Warm Springs Rd Unit 3722
- 2050 W Warm Springs Rd Unit 312
- 2050 W Warm Springs Rd Unit 2024
Your Personal Tour Guide
Ask me questions while you tour the home.