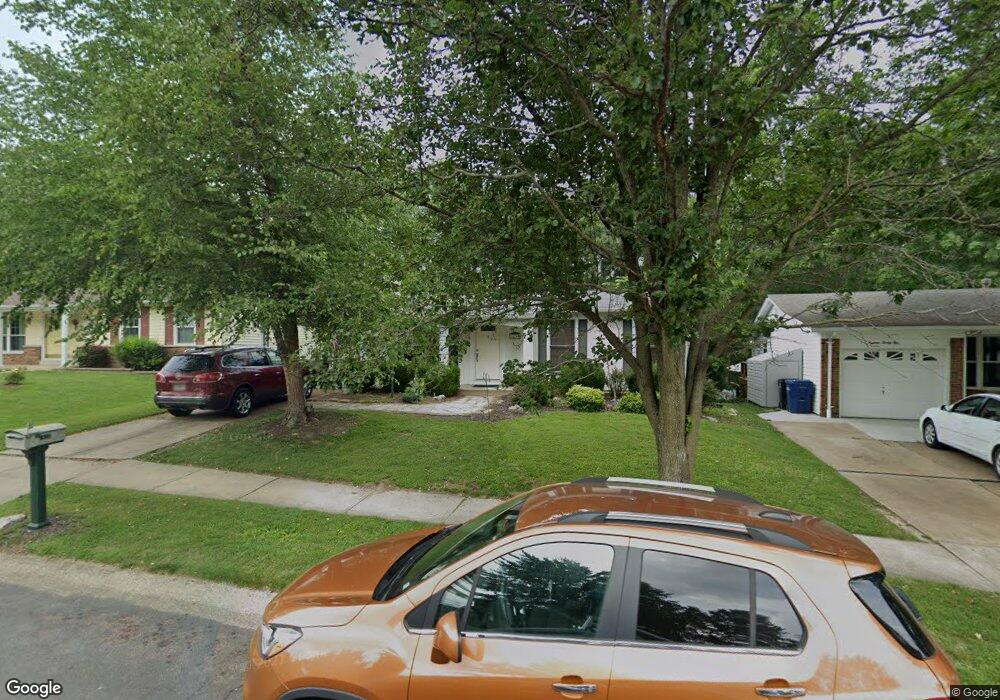
1833 San Luis Rey Pkwy Fenton, MO 63026
Estimated Value: $226,938 - $325,000
3
Beds
1
Bath
939
Sq Ft
$297/Sq Ft
Est. Value
About This Home
This home is located at 1833 San Luis Rey Pkwy, Fenton, MO 63026 and is currently estimated at $278,735, approximately $296 per square foot. 1833 San Luis Rey Pkwy is a home located in St. Louis County with nearby schools including Stanton Elementary School, Rockwood South Middle School, and Rockwood Summit Senior High School.
Ownership History
Date
Name
Owned For
Owner Type
Purchase Details
Closed on
Jun 27, 2020
Sold by
Johnson Deborah Ann
Bought by
Johnson Bryan Scott
Current Estimated Value
Purchase Details
Closed on
Aug 1, 2003
Sold by
Johnson Deborah A and Wilkinson Constance L
Bought by
Johnson Deborah A
Home Financials for this Owner
Home Financials are based on the most recent Mortgage that was taken out on this home.
Original Mortgage
$121,500
Outstanding Balance
$65,893
Interest Rate
8.9%
Mortgage Type
Purchase Money Mortgage
Estimated Equity
$212,842
Purchase Details
Closed on
May 10, 2002
Sold by
Fout Vanessa R W and Fout David L
Bought by
Johnson Deborah A and Wilkinson Constance L
Home Financials for this Owner
Home Financials are based on the most recent Mortgage that was taken out on this home.
Original Mortgage
$77,457
Interest Rate
6.92%
Create a Home Valuation Report for This Property
The Home Valuation Report is an in-depth analysis detailing your home's value as well as a comparison with similar homes in the area
Home Values in the Area
Average Home Value in this Area
Purchase History
| Date | Buyer | Sale Price | Title Company |
|---|---|---|---|
| Johnson Bryan Scott | -- | None Available | |
| Johnson Deborah A | -- | -- | |
| Johnson Deborah A | $134,900 | -- |
Source: Public Records
Mortgage History
| Date | Status | Borrower | Loan Amount |
|---|---|---|---|
| Open | Johnson Deborah A | $121,500 | |
| Closed | Johnson Deborah A | $77,457 |
Source: Public Records
Tax History Compared to Growth
Tax History
| Year | Tax Paid | Tax Assessment Tax Assessment Total Assessment is a certain percentage of the fair market value that is determined by local assessors to be the total taxable value of land and additions on the property. | Land | Improvement |
|---|---|---|---|---|
| 2025 | $2,512 | $37,940 | $19,590 | $18,350 |
| 2024 | $2,512 | $33,540 | $16,210 | $17,330 |
| 2023 | $2,510 | $33,540 | $16,210 | $17,330 |
| 2022 | $2,472 | $30,780 | $16,210 | $14,570 |
| 2021 | $2,453 | $30,780 | $16,210 | $14,570 |
| 2020 | $2,408 | $29,040 | $13,950 | $15,090 |
| 2019 | $2,415 | $29,040 | $13,950 | $15,090 |
| 2018 | $2,060 | $23,730 | $10,490 | $13,240 |
| 2017 | $2,044 | $23,730 | $10,490 | $13,240 |
| 2016 | $1,825 | $21,360 | $8,780 | $12,580 |
| 2015 | $1,787 | $21,360 | $8,780 | $12,580 |
| 2014 | $2,077 | $24,250 | $4,850 | $19,400 |
Source: Public Records
Map
Nearby Homes
- 1883 San Lucas Ln
- 1881 San Pedro Ln
- 1966 San Luis Rey Pkwy
- 1369 Green Birch Ct
- 1376 Remington Oaks Terrace
- 1009 Remington Oaks Ct
- 1851 Hawkins Place
- 678 Greensleeves Dr
- 683 Greenholme Ct
- 1221 Newport Landing Dr
- 1564 Codorniz Ln
- 1222 Perdiz Ln
- 1095 Hawkins Rd
- 1406 Hawkins Meadow Dr
- 1719 Chestnut Farms Ct
- 711 Mosely Ct
- The Westhampton Plan at Bowles Crossing
- The Rockport Plan at Bowles Crossing
- The Richmond Plan at Bowles Crossing
- The Liberty Plan at Bowles Crossing
- 1829 San Luis Rey Pkwy
- 1841 San Luis Rey Pkwy
- 1825 San Luis Rey Pkwy
- 1838 San Luis Rey Pkwy
- 1842 San Luis Rey Pkwy
- 1845 San Luis Rey Pkwy
- 1854 San Luis Rey Pkwy
- 1821 San Pedro Ln
- 1849 San Luis Rey Pkwy
- 1858 San Luis Rey Pkwy
- 1817 San Luis Rey Pkwy
- 1829 San Pedro Ln
- 1831 San Pedro Ln
- 1862 San Luis Rey Pkwy
- 1853 San Luis Rey Pkwy
- 1816 San Luis Rey Pkwy
- 1813 San Luis Rey Pkwy
- 1833 San Pedro Ln
- 1835 San Pedro Ln
- 1866 San Luis Rey Pkwy