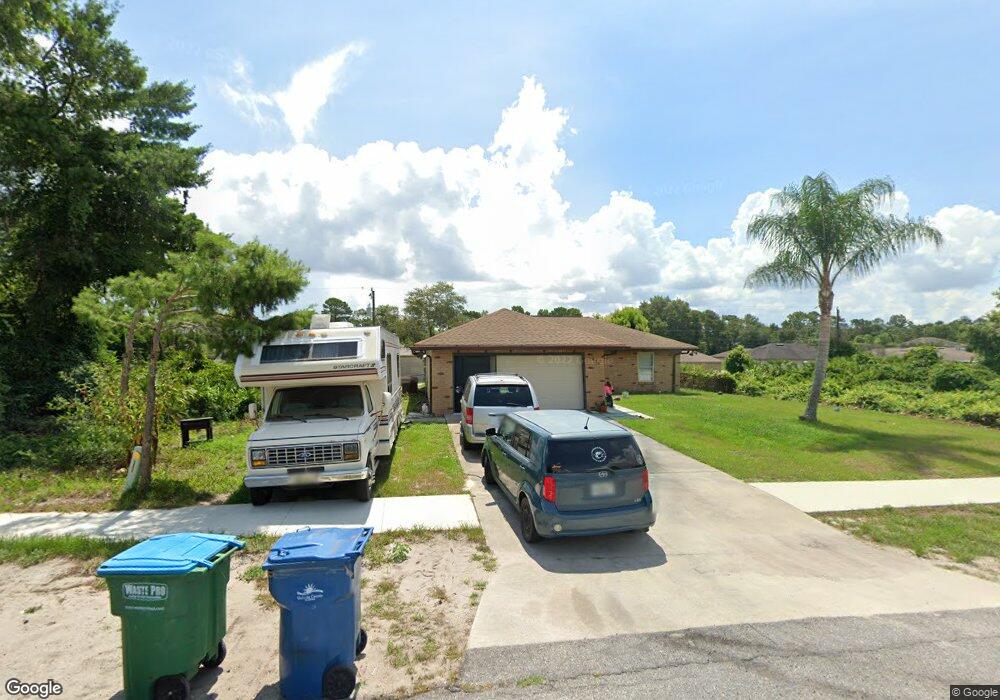
1833 Van Allen Cir Deltona, FL 32738
Estimated Value: $272,000 - $296,000
3
Beds
2
Baths
1,400
Sq Ft
$202/Sq Ft
Est. Value
About This Home
This home is located at 1833 Van Allen Cir, Deltona, FL 32738 and is currently estimated at $282,303, approximately $201 per square foot. 1833 Van Allen Cir is a home located in Volusia County with nearby schools including Pride Elementary School, Heritage Middle School, and Pine Ridge High School.
Ownership History
Date
Name
Owned For
Owner Type
Purchase Details
Closed on
Sep 15, 2005
Sold by
Niverson Dannah M and Niverson Derek
Bought by
Niverson Derek and Niverson Dannah M
Current Estimated Value
Home Financials for this Owner
Home Financials are based on the most recent Mortgage that was taken out on this home.
Original Mortgage
$132,000
Outstanding Balance
$70,220
Interest Rate
5.76%
Mortgage Type
New Conventional
Estimated Equity
$212,083
Purchase Details
Closed on
May 27, 2003
Sold by
Pugh Ralph S and Pugh Sun Young
Bought by
Loder Dannah M and Niverson Derek
Home Financials for this Owner
Home Financials are based on the most recent Mortgage that was taken out on this home.
Original Mortgage
$98,455
Interest Rate
5.79%
Mortgage Type
FHA
Purchase Details
Closed on
Apr 15, 1988
Bought by
Niverson Dannah M and Niverson Derek
Purchase Details
Closed on
Nov 15, 1987
Bought by
Niverson Dannah M and Niverson Derek
Create a Home Valuation Report for This Property
The Home Valuation Report is an in-depth analysis detailing your home's value as well as a comparison with similar homes in the area
Home Values in the Area
Average Home Value in this Area
Purchase History
| Date | Buyer | Sale Price | Title Company |
|---|---|---|---|
| Niverson Derek | -- | American Family Title & Abst | |
| Loder Dannah M | $100,000 | -- | |
| Niverson Dannah M | $58,900 | -- | |
| Niverson Dannah M | $5,500 | -- |
Source: Public Records
Mortgage History
| Date | Status | Borrower | Loan Amount |
|---|---|---|---|
| Open | Niverson Derek | $132,000 | |
| Closed | Loder Dannah M | $98,455 |
Source: Public Records
Tax History Compared to Growth
Tax History
| Year | Tax Paid | Tax Assessment Tax Assessment Total Assessment is a certain percentage of the fair market value that is determined by local assessors to be the total taxable value of land and additions on the property. | Land | Improvement |
|---|---|---|---|---|
| 2025 | $4,054 | $231,394 | $58,000 | $173,394 |
| 2024 | $4,054 | $232,097 | $58,000 | $174,097 |
| 2023 | $4,054 | $242,607 | $56,000 | $186,607 |
| 2022 | $3,677 | $197,394 | $40,000 | $157,394 |
| 2021 | $3,484 | $161,347 | $29,600 | $131,747 |
| 2020 | $3,230 | $150,556 | $21,600 | $128,956 |
| 2019 | $3,094 | $138,504 | $19,520 | $118,984 |
| 2018 | $2,881 | $124,649 | $12,000 | $112,649 |
| 2017 | $2,643 | $104,008 | $8,400 | $95,608 |
| 2016 | $2,351 | $87,084 | $0 | $0 |
| 2015 | $2,245 | $80,267 | $0 | $0 |
| 2014 | $2,190 | $77,986 | $0 | $0 |
Source: Public Records
Map
Nearby Homes
- 1876 Courtland Blvd
- 1742 Van Allen Cir
- 1762 Van Allen Cir
- 3237 Newmark Dr
- 1786 Hazelton Ave
- 3154 Lynnhaven St
- 2074 Laredo Dr
- 2087 Laredo Dr
- 1599 Courtland Blvd
- 1632 Lansfield Ave Unit 43
- 3077 Branchville Dr
- 2048 Laredo Dr
- 1683 Keeling Dr
- 1501 Bonview Ave
- 3043 Mapleshade St
- 1756 Gatewood Dr
- 3307 Caldwell St
- 1912 Maderia Ave
- 3342 Sanborn Ln Unit 47
- 1769 Gatewood Dr
- 1841 Van Allen Cir
- 1828 Courtland Blvd
- 1838 Courtland Blvd
- 1818 Courtland Blvd
- 1817 Van Allen Cir
- 1849 Van Allen Cir
- 1820 Whipple Dr
- 1848 Courtland Blvd
- 1808 Courtland Blvd
- 1809 Van Allen Cir
- 1816 Whipple Dr
- 1798 Courtland Blvd
- 3314 Tallwood Dr
- 1857 Van Allen Cir
- 1801 Van Allen Cir
- 1829 Courtland Blvd
- 1839 Courtland Blvd
- 1812 Whipple Dr
- 1788 Courtland Blvd
- 1819 Courtland Blvd