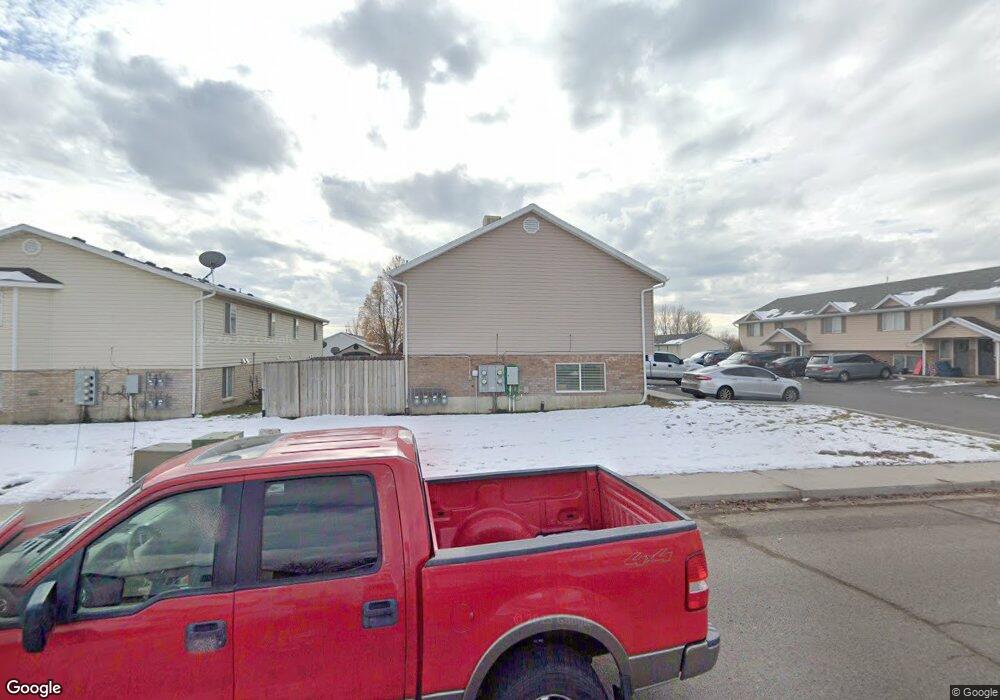
1833 W 800 N Pleasant Grove, UT 84062
Estimated Value: $326,608 - $372,000
3
Beds
2
Baths
1,200
Sq Ft
$291/Sq Ft
Est. Value
About This Home
This home is located at 1833 W 800 N, Pleasant Grove, UT 84062 and is currently estimated at $349,152, approximately $290 per square foot. 1833 W 800 N is a home located in Utah County with nearby schools including Mount Mahogany School, Pleasant Grove Junior High School, and Pleasant Grove High School.
Ownership History
Date
Name
Owned For
Owner Type
Purchase Details
Closed on
Mar 6, 2012
Sold by
Hsbc Mortgage Services Inc
Bought by
Carter David and Bollschweiler Teresa R
Current Estimated Value
Home Financials for this Owner
Home Financials are based on the most recent Mortgage that was taken out on this home.
Original Mortgage
$63,920
Outstanding Balance
$43,888
Interest Rate
3.86%
Mortgage Type
New Conventional
Estimated Equity
$305,264
Purchase Details
Closed on
Nov 28, 2011
Sold by
Smith Jason D and Smith Tamara Kay
Bought by
Hsbc Mortgage Services Inc
Purchase Details
Closed on
Aug 16, 2006
Sold by
Martins Flavio and Martins Niki
Bought by
Smith Jason D and Smith Tamara Kay
Home Financials for this Owner
Home Financials are based on the most recent Mortgage that was taken out on this home.
Original Mortgage
$134,000
Interest Rate
8.99%
Mortgage Type
Purchase Money Mortgage
Purchase Details
Closed on
Jun 16, 2004
Sold by
Vanwagenen Robert S and Vanwagenen April J
Bought by
Martins Flavio and Martins Niki
Create a Home Valuation Report for This Property
The Home Valuation Report is an in-depth analysis detailing your home's value as well as a comparison with similar homes in the area
Home Values in the Area
Average Home Value in this Area
Purchase History
| Date | Buyer | Sale Price | Title Company |
|---|---|---|---|
| Carter David | -- | None Available | |
| Hsbc Mortgage Services Inc | -- | Inwest Title Ogden | |
| Smith Jason D | -- | Horizon Title Insurance | |
| Martins Flavio | -- | Empire Land Title Company |
Source: Public Records
Mortgage History
| Date | Status | Borrower | Loan Amount |
|---|---|---|---|
| Open | Carter David | $63,920 | |
| Previous Owner | Smith Jason D | $134,000 |
Source: Public Records
Tax History Compared to Growth
Tax History
| Year | Tax Paid | Tax Assessment Tax Assessment Total Assessment is a certain percentage of the fair market value that is determined by local assessors to be the total taxable value of land and additions on the property. | Land | Improvement |
|---|---|---|---|---|
| 2025 | $1,444 | $176,275 | $47,100 | $273,400 |
| 2024 | $1,444 | $171,655 | $0 | $0 |
| 2023 | $1,169 | $142,835 | $0 | $0 |
| 2022 | $929 | $112,915 | $0 | $0 |
| 2021 | $816 | $151,000 | $18,100 | $132,900 |
| 2020 | $764 | $138,600 | $16,600 | $122,000 |
| 2019 | $671 | $126,000 | $16,000 | $110,000 |
| 2018 | $710 | $126,000 | $16,000 | $110,000 |
| 2017 | $734 | $69,300 | $0 | $0 |
| 2016 | $760 | $69,300 | $0 | $0 |
| 2015 | $802 | $69,300 | $0 | $0 |
| 2014 | $784 | $67,045 | $0 | $0 |
Source: Public Records
Map
Nearby Homes
- 759 W 930 N Unit 502
- 708 W 930 N Unit 505
- 734 W 930 N Unit 506
- 1598 W 220 N
- 1879 W 1100 N
- 1515 W 1010 St N
- 1491 W 1010 N
- 1541 W 1060 N
- 1443 W 1010 N
- 1088 E 390 S
- 1498 W 1060 N Unit 5
- Lytham Plan at Grove Acres
- 293 N 1630 W
- 295 N 1580 W
- 1065 N 1420 W
- 1096 N 1420 St W Unit 27
- 1525 W 300 N
- 152 S 930 E
- 1171 N 1430 W
- 1541 W 250 N