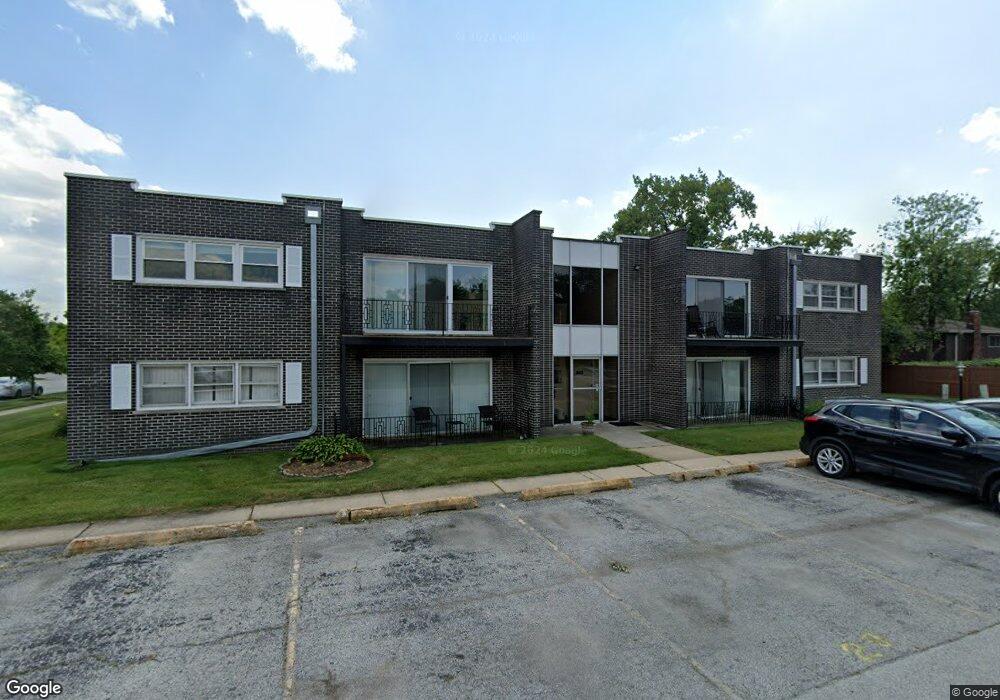
18330 Cherry Creek Dr Unit 3 Homewood, IL 60430
Estimated Value: $108,000 - $120,000
2
Beds
1
Bath
1,000
Sq Ft
$115/Sq Ft
Est. Value
About This Home
This home is located at 18330 Cherry Creek Dr Unit 3, Homewood, IL 60430 and is currently estimated at $115,291, approximately $115 per square foot. 18330 Cherry Creek Dr Unit 3 is a home located in Cook County with nearby schools including Western Avenue Elementary School, Parker Junior High School, and Homewood-Flossmoor High School.
Ownership History
Date
Name
Owned For
Owner Type
Purchase Details
Closed on
Jul 31, 2015
Sold by
Fox Catherine
Bought by
Global Enterprize Services Inc
Current Estimated Value
Purchase Details
Closed on
Oct 21, 2011
Sold by
Magid Gerald
Bought by
Fox Catherine
Purchase Details
Closed on
Dec 7, 2005
Sold by
Csi Cherry Brook Llc
Bought by
Magid Mildred
Purchase Details
Closed on
Mar 1, 2005
Sold by
Cole Taylor Bank
Bought by
Csi Cherry Brook Llc
Home Financials for this Owner
Home Financials are based on the most recent Mortgage that was taken out on this home.
Original Mortgage
$2,262,015
Interest Rate
5.7%
Mortgage Type
Unknown
Purchase Details
Closed on
Nov 30, 1994
Sold by
Vasquez Bulmaro and Vasquez Teresa
Bought by
Cole Taylor Bank
Create a Home Valuation Report for This Property
The Home Valuation Report is an in-depth analysis detailing your home's value as well as a comparison with similar homes in the area
Home Values in the Area
Average Home Value in this Area
Purchase History
| Date | Buyer | Sale Price | Title Company |
|---|---|---|---|
| Global Enterprize Services Inc | $50,000 | Chicago Title Insurance Co | |
| Fox Catherine | $38,500 | Attorneys Title Guaranty Fun | |
| Magid Mildred | $123,000 | Chicago Title Insurance Comp | |
| Csi Cherry Brook Llc | $2,000,000 | Cti | |
| Cole Taylor Bank | -- | -- | |
| Vasquez Bularmo | $286,000 | -- |
Source: Public Records
Mortgage History
| Date | Status | Borrower | Loan Amount |
|---|---|---|---|
| Previous Owner | Csi Cherry Brook Llc | $2,262,015 |
Source: Public Records
Tax History Compared to Growth
Tax History
| Year | Tax Paid | Tax Assessment Tax Assessment Total Assessment is a certain percentage of the fair market value that is determined by local assessors to be the total taxable value of land and additions on the property. | Land | Improvement |
|---|---|---|---|---|
| 2024 | $3,306 | $8,630 | $1,014 | $7,616 |
| 2023 | $1,779 | $8,630 | $1,014 | $7,616 |
| 2022 | $1,779 | $3,627 | $1,014 | $2,613 |
| 2021 | $1,779 | $3,625 | $1,013 | $2,612 |
| 2020 | $1,706 | $3,625 | $1,013 | $2,612 |
| 2019 | $1,635 | $3,316 | $954 | $2,362 |
| 2018 | $1,642 | $3,419 | $954 | $2,465 |
| 2017 | $1,612 | $3,419 | $954 | $2,465 |
| 2016 | $1,666 | $3,416 | $894 | $2,522 |
| 2015 | $1,779 | $3,637 | $894 | $2,743 |
| 2014 | -- | $3,637 | $894 | $2,743 |
| 2013 | -- | $4,236 | $894 | $3,342 |
Source: Public Records
Map
Nearby Homes
- 18340 Cherry Creek Dr Unit 7
- 18400 Cherry Creek Dr Unit 105
- 2807 Willow Rd Unit 103
- 18327 Argyle Ave
- 18509 Stedhall Rd
- 18530 Stedhall Rd
- 2619 Alexander St
- 18310 Robin Ln Unit D2
- 18210 Perth Ave
- 18314 Dundee Ave
- 18434 Dundee Ave
- 2533 Hickory Rd
- 18524 Dundee Ave
- 3048 Matthew Ln Unit B3
- 3013 Carmel Dr
- 18024 Marlin Ln
- 625 Perth Ave
- 3007 Monterey Dr
- 18445 Kedzie Ave
- 18107 Kedzie Ave
- 18330 Cherry Creek Dr Unit 6
- 18330 Cherry Creek Dr Unit 4
- 18330 Cherry Creek Dr Unit 183
- 18330 Cherry Creek Dr Unit 183
- 18330 Cherry Creek Dr Unit 183
- 18330 Cherry Creek Dr Unit 183
- 18330 Cherry Creek Dr Unit 183
- 18330 Cherry Creek Dr Unit 183
- 18330 Cherry Creek Dr Unit 183
- 18330 Cherry Creek Dr Unit 183
- 18330 Cherry Creek Dr
- 18330 Cherry Creek Dr Unit 8
- 18330 Cherry Creek Dr Unit 5
- 18340 Cherry Creek Dr Unit 183
- 18340 Cherry Creek Dr Unit 183
- 18340 Cherry Creek Dr Unit 183
- 18340 Cherry Creek Dr Unit 183
- 18340 Cherry Creek Dr Unit 183
- 18340 Cherry Creek Dr Unit 183
- 18340 Cherry Creek Dr Unit 183