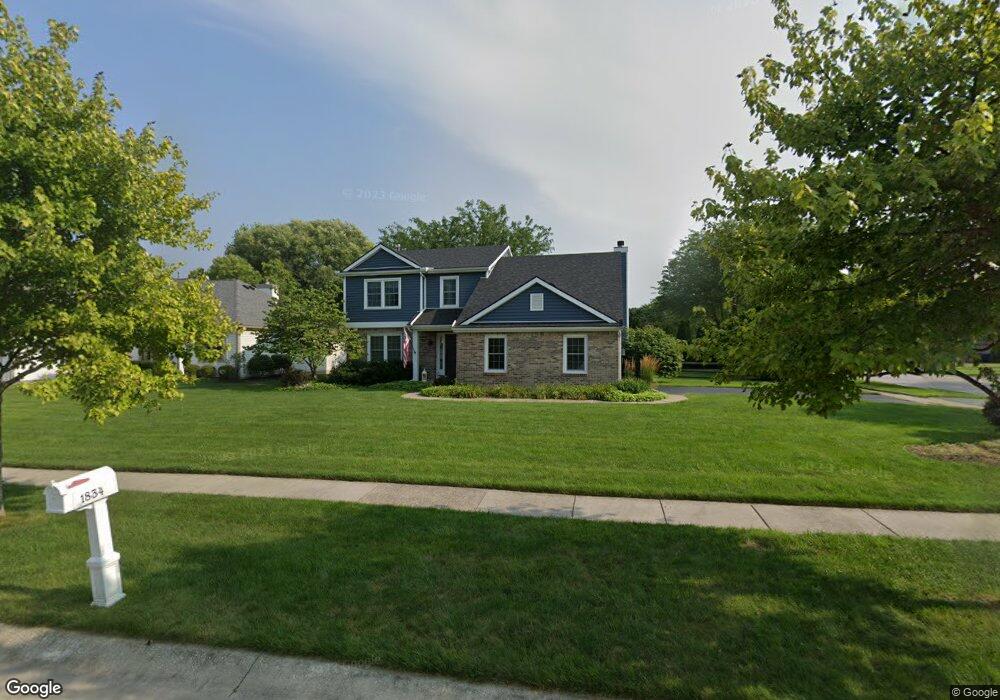
1834 Eaglecrest Rd Perrysburg, OH 43551
Estimated Value: $360,411 - $386,000
4
Beds
3
Baths
2,014
Sq Ft
$183/Sq Ft
Est. Value
About This Home
This home is located at 1834 Eaglecrest Rd, Perrysburg, OH 43551 and is currently estimated at $368,853, approximately $183 per square foot. 1834 Eaglecrest Rd is a home located in Wood County with nearby schools including Fort Meigs Elementary School, Perrysburg Junior High School, and Perrysburg High School.
Ownership History
Date
Name
Owned For
Owner Type
Purchase Details
Closed on
Jun 10, 2004
Sold by
Sams Steven E and Sams Kimberly S
Bought by
Butera Ii Richard L and Butera Lisa M
Current Estimated Value
Home Financials for this Owner
Home Financials are based on the most recent Mortgage that was taken out on this home.
Original Mortgage
$216,500
Outstanding Balance
$107,038
Interest Rate
6.17%
Mortgage Type
Purchase Money Mortgage
Estimated Equity
$261,815
Purchase Details
Closed on
Feb 20, 2002
Sold by
Connor Daniel F and Connor Mary E
Bought by
Sams Steven E and Sams Kimberly S
Home Financials for this Owner
Home Financials are based on the most recent Mortgage that was taken out on this home.
Original Mortgage
$174,600
Interest Rate
7.14%
Purchase Details
Closed on
May 17, 1994
Bought by
Connor Daniel F and Connor Mary E
Purchase Details
Closed on
Dec 17, 1992
Bought by
Society Bank & Trust Tr
Create a Home Valuation Report for This Property
The Home Valuation Report is an in-depth analysis detailing your home's value as well as a comparison with similar homes in the area
Home Values in the Area
Average Home Value in this Area
Purchase History
| Date | Buyer | Sale Price | Title Company |
|---|---|---|---|
| Butera Ii Richard L | $217,000 | Louisville Title | |
| Sams Steven E | $194,000 | Louisville Title Agency For | |
| Connor Daniel F | $32,900 | -- | |
| Society Bank & Trust Tr | $348,500 | -- |
Source: Public Records
Mortgage History
| Date | Status | Borrower | Loan Amount |
|---|---|---|---|
| Open | Butera Ii Richard L | $216,500 | |
| Previous Owner | Sams Steven E | $174,600 |
Source: Public Records
Tax History Compared to Growth
Tax History
| Year | Tax Paid | Tax Assessment Tax Assessment Total Assessment is a certain percentage of the fair market value that is determined by local assessors to be the total taxable value of land and additions on the property. | Land | Improvement |
|---|---|---|---|---|
| 2024 | $5,279 | $91,245 | $16,555 | $74,690 |
| 2023 | $5,279 | $91,250 | $16,560 | $74,690 |
| 2021 | $4,693 | $74,660 | $14,000 | $60,660 |
| 2020 | $4,668 | $74,660 | $14,000 | $60,660 |
| 2019 | $4,131 | $64,120 | $14,000 | $50,120 |
| 2018 | $3,667 | $64,120 | $14,000 | $50,120 |
| 2017 | $3,618 | $64,120 | $14,000 | $50,120 |
| 2016 | $3,710 | $62,440 | $14,700 | $47,740 |
| 2015 | $3,710 | $62,440 | $14,700 | $47,740 |
| 2014 | $3,742 | $62,440 | $14,700 | $47,740 |
| 2013 | $3,646 | $59,470 | $14,000 | $45,470 |
Source: Public Records
Map
Nearby Homes
- 2053 Lexington Dr
- 2062 Lexington Dr
- 26835 Mohawk Dr
- 13975 Eckel Junction Rd
- 26951 Ottekee Dr
- 26802 Fort Meigs Rd
- 125 Ottekee Dr
- 700 Delaware Dr
- 1626 Woodstream Rd
- 664 Little Creek Dr
- 670 Ridge Lake Ct
- 471 Rutledge Ct
- 0 Brookwoode Rd
- 142 Barton Creek Dr
- 144 Barton Creek Dr
- 140 Barton Creek Dr
- 454 S Ridge Dr
- 1380 Brookwoode Rd
- 158 Barton Creek Dr
- 168 Barton Creek Dr
- 1822 Eaglecrest Rd
- 2099 Lexington Dr
- 1810 Eaglecrest Rd
- 2089 Lexington Dr
- 920 Hunters Run
- 908 Hunters Run
- 1833 Eaglecrest Rd
- 2077 Lexington Dr
- 894 Hunters Run
- 1794 Eaglecrest Rd
- 1815 Eaglecrest Rd
- 1801 Eaglecrest Rd
- 944 Hunters Run
- 878 Hunters Run
- 2065 Lexington Dr
- 1784 Eaglecrest Rd
- 859 Hunters Run
- 1787 Eaglecrest Rd
- 26698 Mingo Dr
- 26718 Mingo Dr