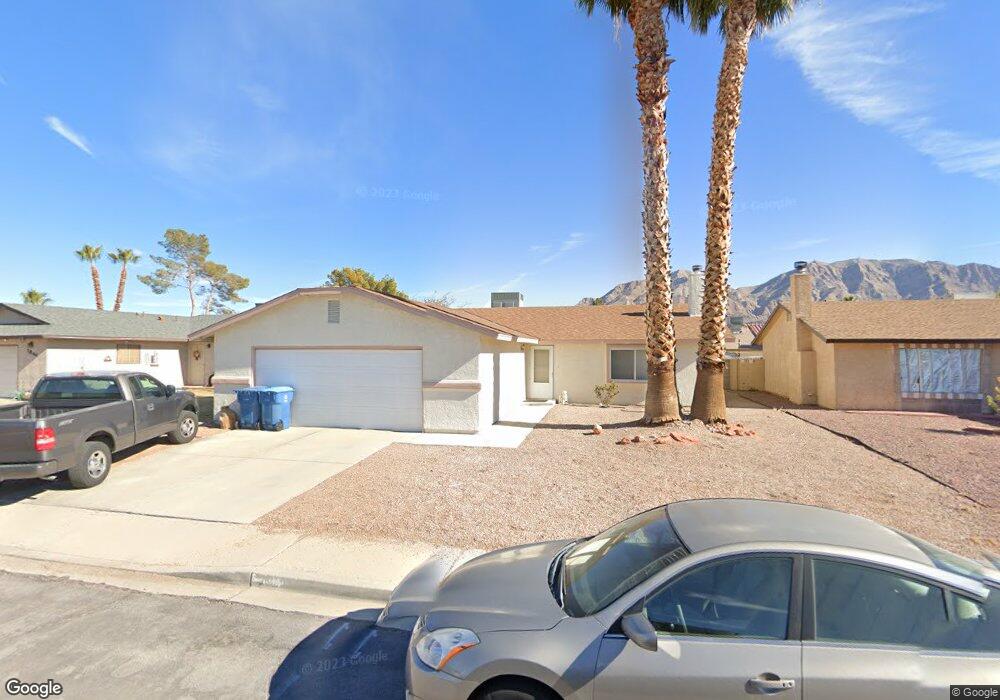
1834 Henson Ln Las Vegas, NV 89156
Estimated Value: $334,000 - $385,000
3
Beds
2
Baths
1,366
Sq Ft
$267/Sq Ft
Est. Value
About This Home
This home is located at 1834 Henson Ln, Las Vegas, NV 89156 and is currently estimated at $365,370, approximately $267 per square foot. 1834 Henson Ln is a home located in Clark County with nearby schools including Mountain View Elementary School, Dr. William H. Bailey Middle School, and Sunrise Mountain High School.
Ownership History
Date
Name
Owned For
Owner Type
Purchase Details
Closed on
Nov 1, 2022
Sold by
Doucette Stephen
Bought by
Simmons Susan M
Current Estimated Value
Purchase Details
Closed on
Oct 9, 2003
Sold by
Resources Group Llc
Bought by
Doucette Stephen and Doucette Elizabeth
Home Financials for this Owner
Home Financials are based on the most recent Mortgage that was taken out on this home.
Original Mortgage
$152,605
Interest Rate
6.27%
Mortgage Type
FHA
Purchase Details
Closed on
Jun 26, 2003
Sold by
Schneider Terry L and Schneider Todd M
Bought by
Resources Group Llc and The Henson Lane Trust
Purchase Details
Closed on
Jul 18, 1997
Sold by
Schneider Terry L and Lee Terry L
Bought by
Schneider Todd M and Schneider Terry L
Home Financials for this Owner
Home Financials are based on the most recent Mortgage that was taken out on this home.
Original Mortgage
$99,200
Interest Rate
7.58%
Create a Home Valuation Report for This Property
The Home Valuation Report is an in-depth analysis detailing your home's value as well as a comparison with similar homes in the area
Home Values in the Area
Average Home Value in this Area
Purchase History
| Date | Buyer | Sale Price | Title Company |
|---|---|---|---|
| Simmons Susan M | $272,000 | Wfg National Title | |
| Doucette Stephen | $155,000 | Land Title Of Nevada | |
| Resources Group Llc | $117,000 | -- | |
| Schneider Todd M | -- | National Title Company |
Source: Public Records
Mortgage History
| Date | Status | Borrower | Loan Amount |
|---|---|---|---|
| Previous Owner | Doucette Stephen | $152,605 | |
| Previous Owner | Schneider Todd M | $99,200 |
Source: Public Records
Tax History Compared to Growth
Tax History
| Year | Tax Paid | Tax Assessment Tax Assessment Total Assessment is a certain percentage of the fair market value that is determined by local assessors to be the total taxable value of land and additions on the property. | Land | Improvement |
|---|---|---|---|---|
| 2025 | $1,225 | $73,921 | $27,650 | $46,271 |
| 2024 | $1,190 | $73,921 | $27,650 | $46,271 |
| 2023 | $1,190 | $71,813 | $27,300 | $44,513 |
| 2022 | $1,156 | $63,301 | $22,050 | $41,251 |
| 2021 | $1,122 | $59,127 | $19,600 | $39,527 |
| 2020 | $1,087 | $58,454 | $18,900 | $39,554 |
| 2019 | $1,073 | $55,383 | $16,100 | $39,283 |
| 2018 | $1,024 | $52,210 | $14,000 | $38,210 |
| 2017 | $1,496 | $50,993 | $11,900 | $39,093 |
| 2016 | $960 | $48,334 | $8,750 | $39,584 |
| 2015 | $957 | $42,063 | $7,000 | $35,063 |
| 2014 | $929 | $33,364 | $7,000 | $26,364 |
Source: Public Records
Map
Nearby Homes
- 5884 Deer Valley Dr
- 5904 Yucca House Ave
- 1676 Buck Island St
- 2030 Toiyabe St
- 1963 Beesley Dr
- 5660 E Lake Mead Blvd
- 5991 Corpus Christi Ct
- 5801 Sunny Orchard Ln
- 5974 Mount Mckinley Ave
- 1831 Castleberry Ln
- 5843 Dew Mist Ln
- 1713 Eddingham Ct
- 1491 Sunrise View Dr
- 6201 E Lake Mead Blvd Unit 151
- 6201 E Lake Mead Blvd Unit E218
- 6201 E Lake Mead Blvd Unit 210
- 0 Meikle Ln
- 6081 Mount Mckinley Ave
- 6192 Glacier Ave
- 6080 E Great Smoky Ave
- 1844 Henson Ln
- 1824 Henson Ln
- 1845 Banaba Ln
- 1814 Henson Ln
- 1854 Henson Ln
- 1855 Banaba Ln Unit 3
- 1833 Henson Ln
- 1823 Henson Ln
- 1843 Henson Ln
- 1825 Banaba Ln
- 1865 Banaba Ln
- 1853 Henson Ln
- 1813 Henson Ln
- 5878 Deer Valley Dr
- 5847 Duval Dr
- 1863 Hasib Ct
- 5888 Deer Valley Dr
- 5854 Deer Valley Dr
- 1854 Trilly Ln
- 1832 Weatherford Way