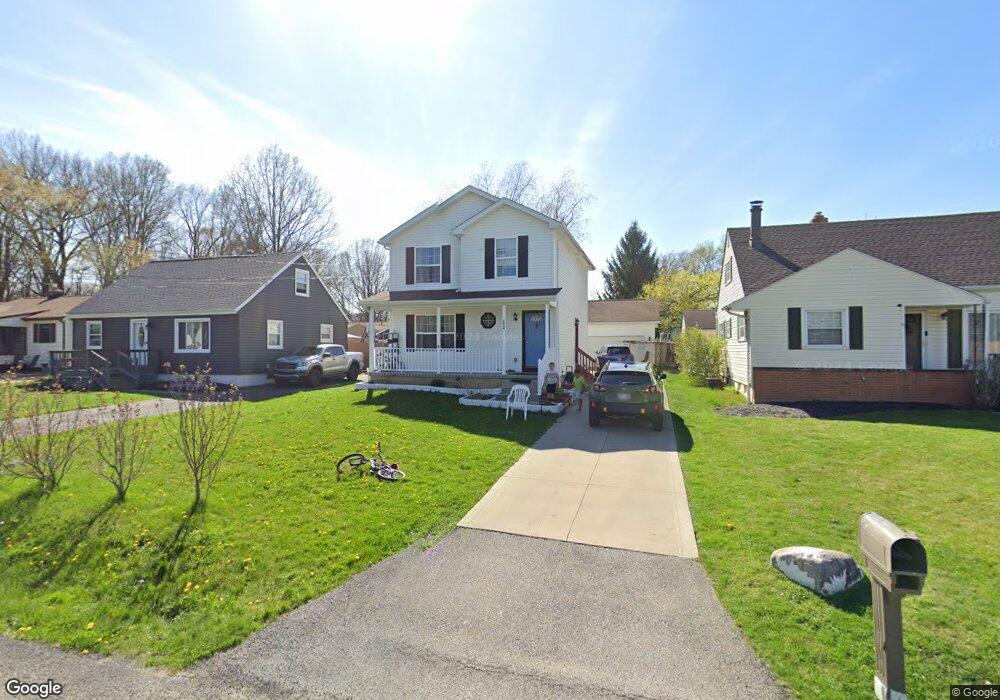
1834 Maurice St Cuyahoga Falls, OH 44221
Northmoreland NeighborhoodEstimated Value: $279,000 - $298,000
3
Beds
3
Baths
1,344
Sq Ft
$214/Sq Ft
Est. Value
About This Home
This home is located at 1834 Maurice St, Cuyahoga Falls, OH 44221 and is currently estimated at $287,090, approximately $213 per square foot. 1834 Maurice St is a home with nearby schools including Elizabeth Price Elementary School, Bolich Middle School, and Cuyahoga Falls High School.
Ownership History
Date
Name
Owned For
Owner Type
Purchase Details
Closed on
Sep 28, 2015
Sold by
Frammartino Vincent D and Frammartino Rosa M
Bought by
Kuikel Santi R and Kuikel Ganga M
Current Estimated Value
Home Financials for this Owner
Home Financials are based on the most recent Mortgage that was taken out on this home.
Original Mortgage
$130,000
Outstanding Balance
$102,144
Interest Rate
3.84%
Mortgage Type
New Conventional
Estimated Equity
$184,946
Purchase Details
Closed on
Nov 25, 2014
Sold by
Tresh Barbara J and Mullis Gena M
Bought by
Frammartino Vincent D and Frammartino Rosa M
Purchase Details
Closed on
Sep 24, 2014
Sold by
Neal Arin M
Bought by
Tresh Barbara J and Mullis Gena M
Purchase Details
Closed on
Jun 27, 2014
Sold by
Tresh Barbara J and Mullis Gena M
Bought by
Neal Arin M
Home Financials for this Owner
Home Financials are based on the most recent Mortgage that was taken out on this home.
Original Mortgage
$67,450
Interest Rate
4.13%
Mortgage Type
New Conventional
Create a Home Valuation Report for This Property
The Home Valuation Report is an in-depth analysis detailing your home's value as well as a comparison with similar homes in the area
Home Values in the Area
Average Home Value in this Area
Purchase History
| Date | Buyer | Sale Price | Title Company |
|---|---|---|---|
| Kuikel Santi R | $162,500 | Athena Box Village Title | |
| Frammartino Vincent D | $10,000 | America Land Title Affiliate | |
| Tresh Barbara J | -- | None Available | |
| Neal Arin M | $71,000 | America Land Title Affiliate |
Source: Public Records
Mortgage History
| Date | Status | Borrower | Loan Amount |
|---|---|---|---|
| Open | Kuikel Santi R | $130,000 | |
| Previous Owner | Neal Arin M | $67,450 |
Source: Public Records
Tax History Compared to Growth
Tax History
| Year | Tax Paid | Tax Assessment Tax Assessment Total Assessment is a certain percentage of the fair market value that is determined by local assessors to be the total taxable value of land and additions on the property. | Land | Improvement |
|---|---|---|---|---|
| 2025 | $4,529 | $83,881 | $11,858 | $72,023 |
| 2024 | $4,529 | $83,881 | $11,858 | $72,023 |
| 2023 | $4,529 | $83,881 | $11,858 | $72,023 |
| 2022 | $4,260 | $64,086 | $8,915 | $55,171 |
| 2021 | $4,260 | $64,086 | $8,915 | $55,171 |
| 2020 | $4,190 | $64,090 | $8,920 | $55,170 |
| 2019 | $4,166 | $58,020 | $8,030 | $49,990 |
| 2018 | $3,538 | $58,020 | $8,030 | $49,990 |
| 2017 | $246 | $58,020 | $8,030 | $49,990 |
| 2016 | $3,239 | $53,800 | $8,030 | $45,770 |
| 2015 | $246 | $3,970 | $3,970 | $0 |
| 2014 | $246 | $3,970 | $3,970 | $0 |
| 2013 | $244 | $3,970 | $3,970 | $0 |
Source: Public Records
Map
Nearby Homes
- 1921 Dwight St
- 1521 Anderson Rd
- 1120 Saxe Ave
- 1140 Cooper Dr
- 1219 Curtis Ave
- 1109 Cooper Dr
- 2100 Delmore St
- 1860 Sequoia St
- 1860 Issaquah St
- 2183 Plymouth Ln
- 907 Broadway St E
- 1633 Bancroft St
- 2300 Larchdale Dr
- 1471 Bancroft St
- 965 Elizabeth Ct
- 1918 Tudor St
- 298 Game Dr
- 1916 Victoria St
- 721 Myrtle Ave
- 2289 Bailey Rd
- 1826 Maurice St
- 1844 Maurice St
- 1854 Maurice St
- 1841 Maurice St
- 1818 Maurice St
- 1862 Maurice St
- 1819 Maurice St
- 1859 Maurice St
- 1808 Maurice St
- 1872 Maurice St
- 1505 Oneida Ave
- 1873 Maurice St
- 1837 Chatam St
- 1845 Chatam St
- 1827 Chatam St
- 1857 Chatam St
- 1880 Maurice St
- 1838 Olympic St
- 1819 Chatam St
- 1830 Olympic St