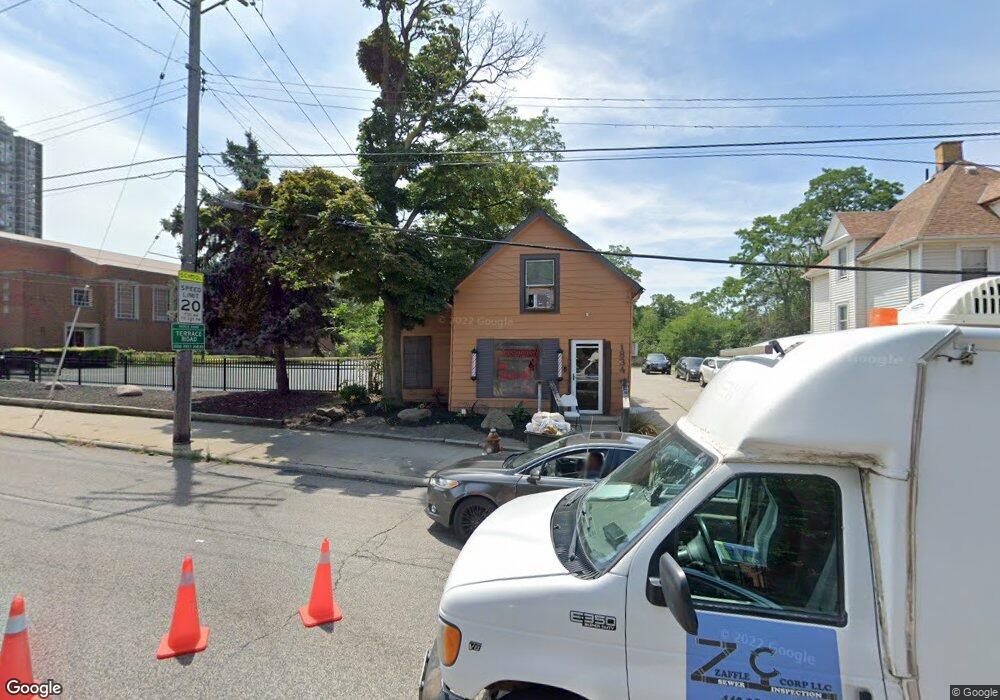
1834 Noble Rd East Cleveland, OH 44112
4
Beds
1
Bath
10,035
Sq Ft
--
Built
About This Home
This home is located at 1834 Noble Rd, East Cleveland, OH 44112. 1834 Noble Rd is a home located in Cuyahoga County with nearby schools including A.C. Jones Health Professions Magnet Academy, Shaw High School, and Apex Academy.
Ownership History
Date
Name
Owned For
Owner Type
Purchase Details
Closed on
Aug 4, 2005
Sold by
Jpmorgan Chase Bank Na
Bought by
Cooper Eric and Cooper Estelle
Purchase Details
Closed on
Apr 18, 2005
Sold by
Snell Johnny L and Snell Dorothy R
Bought by
Bank One
Purchase Details
Closed on
Apr 29, 1999
Sold by
Stanton Friedman R
Bought by
Snell Johnny L
Home Financials for this Owner
Home Financials are based on the most recent Mortgage that was taken out on this home.
Original Mortgage
$39,200
Interest Rate
7.04%
Mortgage Type
Commercial
Purchase Details
Closed on
Oct 29, 1980
Sold by
Friedman Stanton R
Bought by
Stanton Friedman R
Purchase Details
Closed on
Oct 14, 1980
Bought by
Friedman Stanton R
Purchase Details
Closed on
Sep 25, 1980
Sold by
Forman Sidney
Bought by
Terrace Congregation Of
Purchase Details
Closed on
Jan 1, 1975
Bought by
Forman Sidney
Create a Home Valuation Report for This Property
The Home Valuation Report is an in-depth analysis detailing your home's value as well as a comparison with similar homes in the area
Home Values in the Area
Average Home Value in this Area
Purchase History
| Date | Buyer | Sale Price | Title Company |
|---|---|---|---|
| Cooper Eric | $15,000 | Phoenix Title Agency | |
| Bank One | $31,334 | -- | |
| Snell Johnny L | $56,000 | -- | |
| Stanton Friedman R | -- | -- | |
| Friedman Stanton R | $10,500 | -- | |
| Terrace Congregation Of | -- | -- | |
| Forman Sidney | -- | -- |
Source: Public Records
Mortgage History
| Date | Status | Borrower | Loan Amount |
|---|---|---|---|
| Previous Owner | Snell Johnny L | $39,200 |
Source: Public Records
Tax History Compared to Growth
Tax History
| Year | Tax Paid | Tax Assessment Tax Assessment Total Assessment is a certain percentage of the fair market value that is determined by local assessors to be the total taxable value of land and additions on the property. | Land | Improvement |
|---|---|---|---|---|
| 2024 | $1,869 | $17,290 | $7,070 | $10,220 |
| 2023 | $1,635 | $13,650 | $7,070 | $6,580 |
| 2022 | $1,637 | $13,650 | $7,070 | $6,580 |
| 2021 | $1,634 | $13,650 | $7,070 | $6,580 |
| 2020 | $1,717 | $13,650 | $7,070 | $6,580 |
| 2019 | $1,831 | $39,000 | $20,200 | $18,800 |
| 2018 | $1,590 | $13,650 | $7,070 | $6,580 |
| 2017 | $1,370 | $9,560 | $4,830 | $4,730 |
| 2016 | $1,358 | $9,560 | $4,830 | $4,730 |
| 2015 | $1,535 | $9,560 | $4,830 | $4,730 |
| 2014 | $1,535 | $11,940 | $6,020 | $5,920 |
Source: Public Records
Map
Nearby Homes
- 1770 Alcoy Rd
- 1762 Alcoy Rd
- 1854 Hastings Ave
- 1872 Lampson Rd
- 1816 Lampson Rd
- 1875 Lampson Rd
- 1731 Taylor Rd
- 2121 Alton Rd
- 1851 Sheldon Ave
- 2116 Reyburn Rd
- 14725 Elm Ave
- 861 Caledonia Ave
- 935 Ravine Dr
- 1758 Algonac Rd
- 14705 Alder Ave
- 1754 Algonac Rd
- 817 Helmsdale Rd
- 825 Helmsdale Rd
- 1767 Algonac Rd Unit 2
- 841 Helmsdale Rd