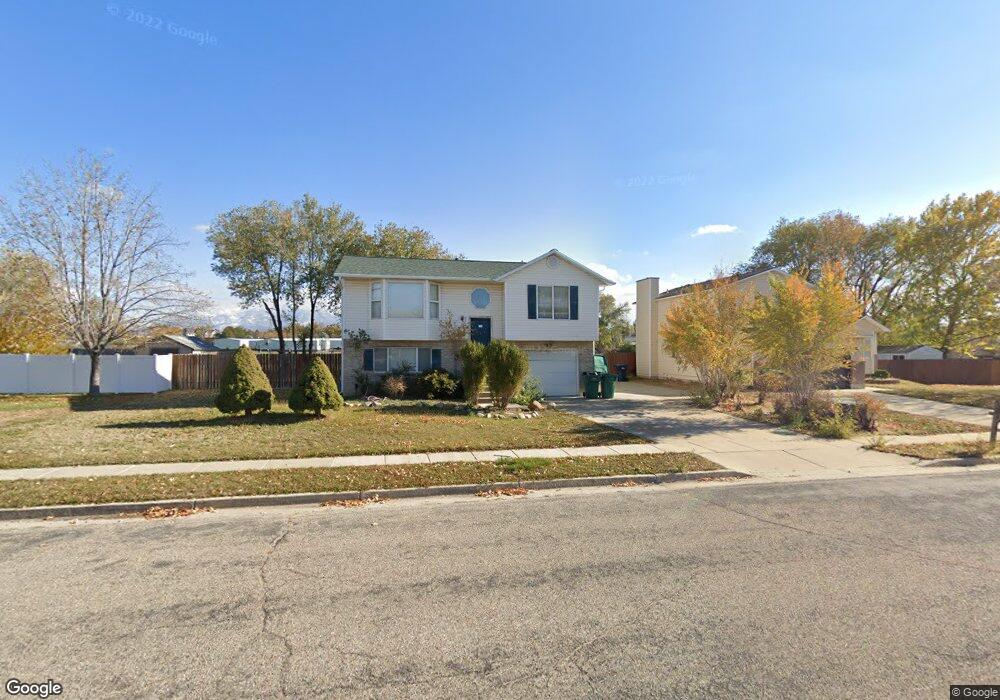
1834 S 200 W Clearfield, UT 84015
Estimated Value: $377,000 - $413,791
3
Beds
1
Bath
1,698
Sq Ft
$236/Sq Ft
Est. Value
About This Home
This home is located at 1834 S 200 W, Clearfield, UT 84015 and is currently estimated at $400,448, approximately $235 per square foot. 1834 S 200 W is a home located in Davis County with nearby schools including Antelope Elementary School, North Davis Junior High School, and Clearfield High School.
Ownership History
Date
Name
Owned For
Owner Type
Purchase Details
Closed on
Feb 21, 2017
Sold by
Morgan Daryl P
Bought by
Morgan Daryl
Current Estimated Value
Home Financials for this Owner
Home Financials are based on the most recent Mortgage that was taken out on this home.
Original Mortgage
$124,500
Interest Rate
4.12%
Mortgage Type
New Conventional
Purchase Details
Closed on
May 13, 2014
Sold by
Morgan Deryl P
Bought by
Morgan Deryl P
Home Financials for this Owner
Home Financials are based on the most recent Mortgage that was taken out on this home.
Original Mortgage
$110,000
Interest Rate
4.23%
Mortgage Type
New Conventional
Purchase Details
Closed on
Nov 22, 2000
Sold by
Hanks John P and Hanks Linda W
Bought by
Morgan Daryl P
Home Financials for this Owner
Home Financials are based on the most recent Mortgage that was taken out on this home.
Original Mortgage
$114,059
Interest Rate
7.86%
Mortgage Type
FHA
Create a Home Valuation Report for This Property
The Home Valuation Report is an in-depth analysis detailing your home's value as well as a comparison with similar homes in the area
Home Values in the Area
Average Home Value in this Area
Purchase History
| Date | Buyer | Sale Price | Title Company |
|---|---|---|---|
| Morgan Daryl | -- | Pinnacle Title | |
| Morgan Deryl P | -- | Cornerstone Title In | |
| Morgan Daryl P | -- | First American Title Co |
Source: Public Records
Mortgage History
| Date | Status | Borrower | Loan Amount |
|---|---|---|---|
| Open | Morgan Daryl | $124,500 | |
| Closed | Morgan Deryl P | $110,000 | |
| Closed | Morgan Daryl P | $114,059 |
Source: Public Records
Tax History Compared to Growth
Tax History
| Year | Tax Paid | Tax Assessment Tax Assessment Total Assessment is a certain percentage of the fair market value that is determined by local assessors to be the total taxable value of land and additions on the property. | Land | Improvement |
|---|---|---|---|---|
| 2024 | $2,242 | $202,400 | $69,677 | $132,723 |
| 2023 | $2,058 | $341,000 | $111,447 | $229,553 |
| 2022 | $2,216 | $198,550 | $64,333 | $134,217 |
| 2021 | $2,016 | $273,000 | $69,058 | $203,942 |
| 2020 | $1,755 | $236,000 | $58,200 | $177,800 |
| 2019 | $1,695 | $225,000 | $60,541 | $164,459 |
| 2018 | $1,531 | $198,000 | $53,736 | $144,264 |
| 2016 | $1,350 | $91,245 | $21,509 | $69,736 |
| 2015 | $1,282 | $82,610 | $21,509 | $61,101 |
| 2014 | $1,234 | $80,580 | $21,509 | $59,071 |
| 2013 | -- | $73,601 | $30,258 | $43,343 |
Source: Public Records
Map
Nearby Homes
- 1987 Katies Way
- 19 W 1900 S
- 1940 S Main St
- 2032 S Jenny Ln W
- 1913 S 525 W
- 2265 S 300 W
- 563 W 2150 S
- 2277 S 300 W
- 308 E 1925 S
- 1906 S 350 E
- 2912 W 1375 N
- 2357 S 225 E
- 823 W 1600 S Unit 13
- 475 W 2400 S
- 3391 W 1125 N
- 460 E 1700 S Unit 1 & 2
- 2745 W 1475 N
- 2872 Lindi Way
- 1912 S 910 W Unit B
- 929 W 1920 S Unit A