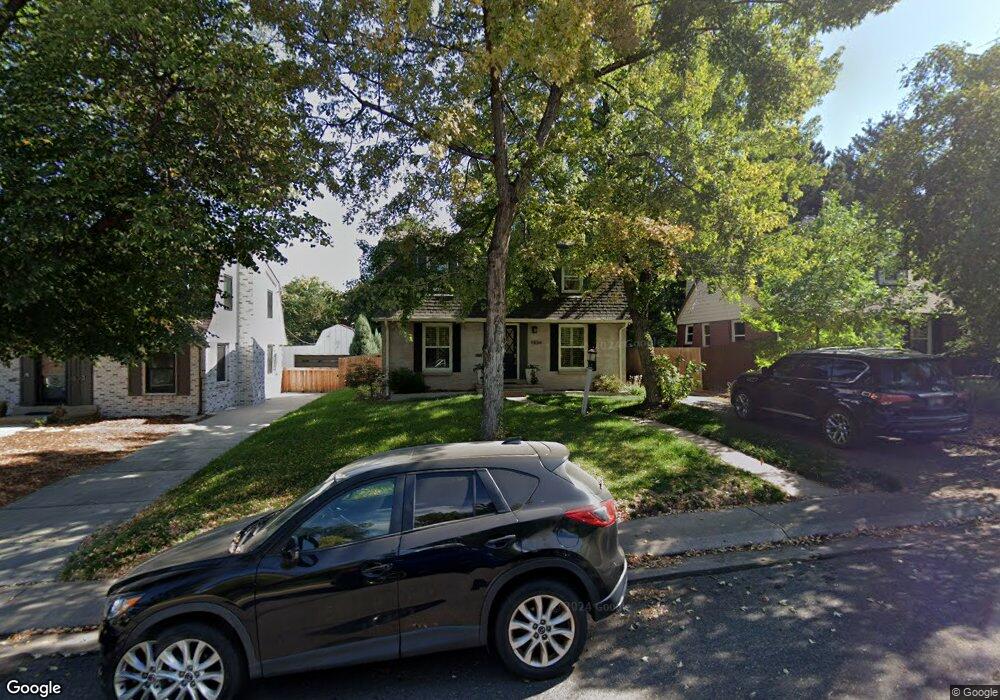
1834 S Clayton St Denver, CO 80210
University Park NeighborhoodEstimated Value: $882,000 - $1,037,000
4
Beds
3
Baths
2,520
Sq Ft
$376/Sq Ft
Est. Value
About This Home
This home is located at 1834 S Clayton St, Denver, CO 80210 and is currently estimated at $948,657, approximately $376 per square foot. 1834 S Clayton St is a home located in Denver County with nearby schools including University Park Elementary School, Merrill Middle School, and South High School.
Ownership History
Date
Name
Owned For
Owner Type
Purchase Details
Closed on
Jun 21, 2021
Sold by
Call Scott and Rezende Leticia
Bought by
Heringer Cassie and Machado Michael
Current Estimated Value
Home Financials for this Owner
Home Financials are based on the most recent Mortgage that was taken out on this home.
Original Mortgage
$676,000
Outstanding Balance
$612,034
Interest Rate
2.9%
Mortgage Type
New Conventional
Estimated Equity
$336,623
Purchase Details
Closed on
Apr 27, 2012
Sold by
Gic Llc
Bought by
Call Scott and Rezende Leticia
Home Financials for this Owner
Home Financials are based on the most recent Mortgage that was taken out on this home.
Original Mortgage
$324,000
Interest Rate
4.02%
Mortgage Type
New Conventional
Purchase Details
Closed on
Nov 23, 2011
Sold by
Cox Gregort J
Bought by
Gic Llc
Purchase Details
Closed on
Oct 25, 2011
Sold by
Gic Llc
Bought by
Cox Gregory L
Purchase Details
Closed on
Jun 15, 2011
Sold by
Walker Jerry Ann
Bought by
Gic Llc
Create a Home Valuation Report for This Property
The Home Valuation Report is an in-depth analysis detailing your home's value as well as a comparison with similar homes in the area
Home Values in the Area
Average Home Value in this Area
Purchase History
| Date | Buyer | Sale Price | Title Company |
|---|---|---|---|
| Heringer Cassie | $845,000 | Heritage Title Company | |
| Call Scott | $405,000 | Land Title Guarantee Company | |
| Gic Llc | -- | None Available | |
| Cox Gregory L | -- | None Available | |
| Gic Llc | $226,750 | Land Title Guarantee Company |
Source: Public Records
Mortgage History
| Date | Status | Borrower | Loan Amount |
|---|---|---|---|
| Open | Heringer Cassie | $676,000 | |
| Previous Owner | Call Scott | $324,000 |
Source: Public Records
Tax History Compared to Growth
Tax History
| Year | Tax Paid | Tax Assessment Tax Assessment Total Assessment is a certain percentage of the fair market value that is determined by local assessors to be the total taxable value of land and additions on the property. | Land | Improvement |
|---|---|---|---|---|
| 2024 | $4,844 | $61,160 | $34,590 | $26,570 |
| 2023 | $4,739 | $61,160 | $34,590 | $26,570 |
| 2022 | $4,597 | $57,810 | $27,290 | $30,520 |
| 2021 | $4,597 | $59,480 | $28,080 | $31,400 |
| 2020 | $4,073 | $54,900 | $24,250 | $30,650 |
| 2019 | $3,959 | $54,900 | $24,250 | $30,650 |
| 2018 | $3,273 | $42,310 | $21,850 | $20,460 |
| 2017 | $3,264 | $42,310 | $21,850 | $20,460 |
| 2016 | $2,807 | $34,420 | $18,475 | $15,945 |
| 2015 | $2,689 | $34,420 | $18,475 | $15,945 |
| 2014 | $2,594 | $31,230 | $19,892 | $11,338 |
Source: Public Records
Map
Nearby Homes
- 1875 S Clayton St
- 1907 S Columbine St
- 1925 S Columbine St
- 1950 S Milwaukee St
- 1665 S Fillmore St
- 2067 S Clayton St
- 1840 S Steele St
- 2077 S Clayton St
- 1624 S Elizabeth St
- 1625 S Fillmore St
- 1904 S Adams St
- 1880 S Adams St
- 1675 S Steele St
- 1790 S Adams St
- 2225 Buchtel Blvd Unit 1011
- 2225 Buchtel Blvd Unit 703
- 2225 Buchtel Blvd Unit 1007
- 2225 Buchtel Blvd Unit 506
- 2225 Buchtel Blvd Unit 105
- 2225 Buchtel Blvd Unit 1005
- 1840 S Clayton St
- 1824 S Clayton St
- 1850 S Clayton St
- 1814 S Clayton St
- 1860 S Clayton St
- 1810 S Clayton St
- 1825 S Fillmore St
- 1831 S Fillmore St
- 1821 S Fillmore St
- 1841 S Fillmore St
- 1866 S Clayton St
- 1800 S Clayton St
- 2810 E Colorado Ave
- 1851 S Fillmore St
- 1833 S Clayton St
- 1839 S Clayton St
- 2820 E Colorado Ave
- 1825 S Clayton St
- 1874 S Clayton St
- 1843 S Clayton St