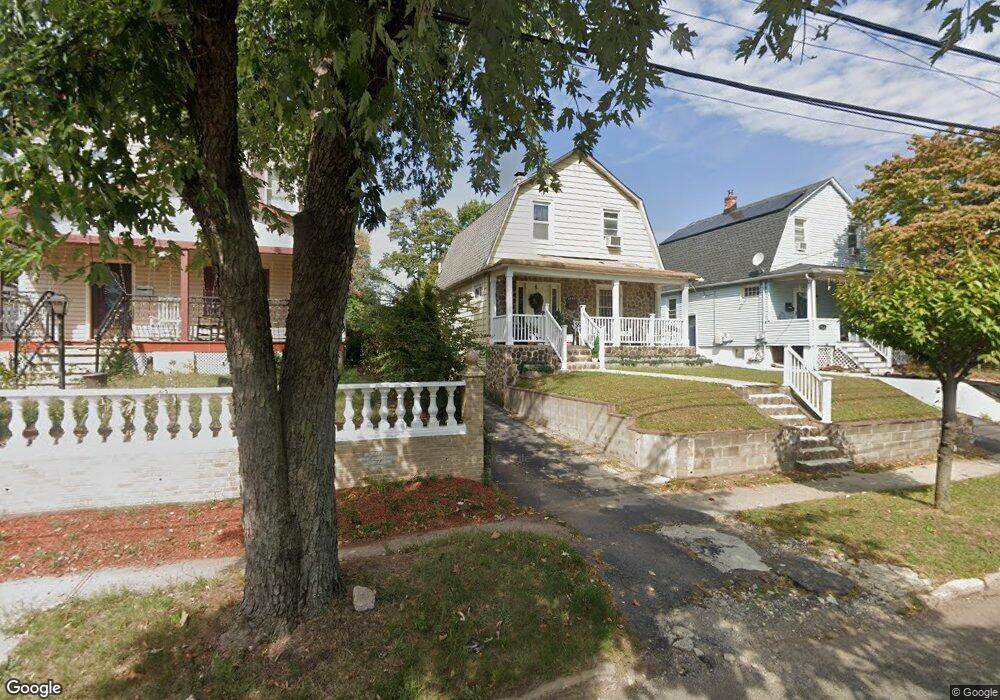
1834 W 7th St Piscataway, NJ 08854
Estimated Value: $487,000 - $596,000
--
Bed
--
Bath
1,429
Sq Ft
$376/Sq Ft
Est. Value
About This Home
This home is located at 1834 W 7th St, Piscataway, NJ 08854 and is currently estimated at $537,263, approximately $375 per square foot. 1834 W 7th St is a home located in Middlesex County with nearby schools including Arbor Intermediate School, Dwight D. Eisenhower School, and Quibbletown Middle School.
Ownership History
Date
Name
Owned For
Owner Type
Purchase Details
Closed on
Feb 24, 2003
Sold by
Homeside Lending
Bought by
Dinzey Quenia
Current Estimated Value
Home Financials for this Owner
Home Financials are based on the most recent Mortgage that was taken out on this home.
Original Mortgage
$137,800
Interest Rate
5.86%
Mortgage Type
FHA
Purchase Details
Closed on
Jul 14, 2000
Sold by
Spiezia William
Bought by
Rashid Charles and Orquindea Rashid
Home Financials for this Owner
Home Financials are based on the most recent Mortgage that was taken out on this home.
Original Mortgage
$142,427
Interest Rate
8.06%
Mortgage Type
FHA
Purchase Details
Closed on
Oct 7, 1999
Sold by
Wlodarski Bohdan
Bought by
Spiezia William and Spiezia Jacqueline
Home Financials for this Owner
Home Financials are based on the most recent Mortgage that was taken out on this home.
Original Mortgage
$87,300
Interest Rate
7.83%
Create a Home Valuation Report for This Property
The Home Valuation Report is an in-depth analysis detailing your home's value as well as a comparison with similar homes in the area
Home Values in the Area
Average Home Value in this Area
Purchase History
| Date | Buyer | Sale Price | Title Company |
|---|---|---|---|
| Dinzey Quenia | $140,000 | -- | |
| Rashid Charles | $142,500 | -- | |
| Spiezia William | $97,000 | -- |
Source: Public Records
Mortgage History
| Date | Status | Borrower | Loan Amount |
|---|---|---|---|
| Previous Owner | Dinzey Quenia | $137,800 | |
| Previous Owner | Rashid Charles | $142,427 | |
| Previous Owner | Spiezia William | $87,300 |
Source: Public Records
Tax History Compared to Growth
Tax History
| Year | Tax Paid | Tax Assessment Tax Assessment Total Assessment is a certain percentage of the fair market value that is determined by local assessors to be the total taxable value of land and additions on the property. | Land | Improvement |
|---|---|---|---|---|
| 2025 | $7,210 | $401,200 | $207,700 | $193,500 |
| 2024 | $7,050 | $369,200 | $134,000 | $235,200 |
| 2023 | $7,050 | $337,300 | $134,000 | $203,300 |
| 2022 | $6,805 | $302,300 | $134,000 | $168,300 |
| 2021 | $6,290 | $284,700 | $134,000 | $150,700 |
| 2020 | $6,450 | $276,100 | $107,000 | $169,100 |
| 2019 | $6,204 | $260,900 | $107,000 | $153,900 |
| 2018 | $5,985 | $251,900 | $107,000 | $144,900 |
| 2017 | $6,174 | $224,500 | $89,000 | $135,500 |
| 2016 | $6,055 | $224,500 | $89,000 | $135,500 |
| 2015 | $5,972 | $224,500 | $89,000 | $135,500 |
| 2014 | $5,837 | $224,500 | $89,000 | $135,500 |
Source: Public Records
Map
Nearby Homes