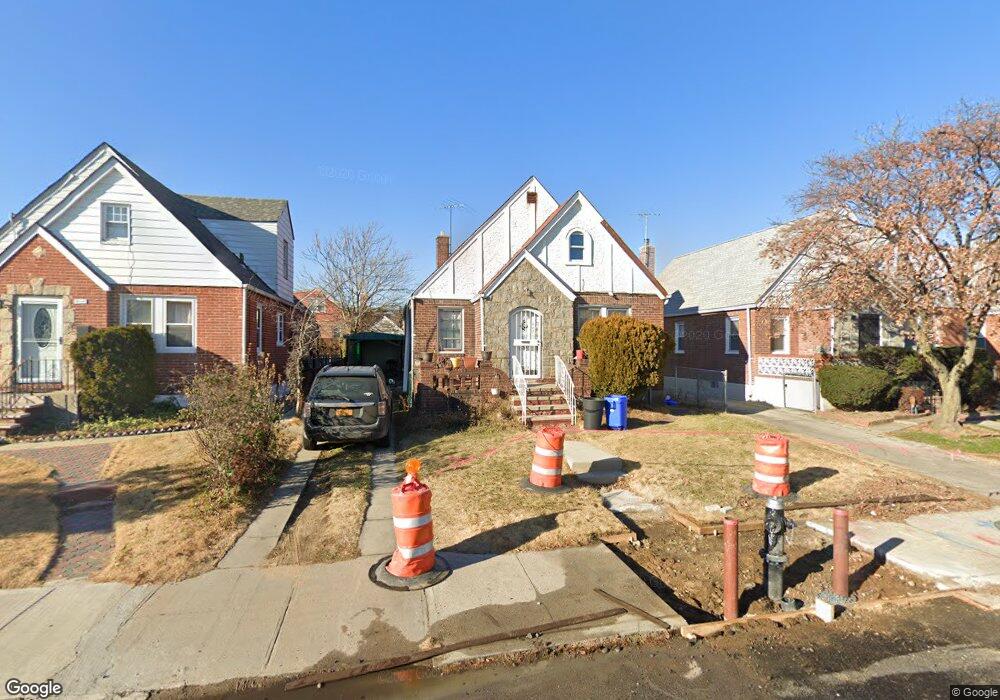
18345 Camden Ave Saint Albans, NY 11412
Hollis NeighborhoodEstimated Value: $737,381 - $822,000
--
Bed
--
Bath
1,493
Sq Ft
$520/Sq Ft
Est. Value
About This Home
This home is located at 18345 Camden Ave, Saint Albans, NY 11412 and is currently estimated at $776,595, approximately $520 per square foot. 18345 Camden Ave is a home located in Queens County with nearby schools including P.S. 118 Lorraine Hansberry, I.S. 192 The Linden, and True Deliverance Christian School.
Ownership History
Date
Name
Owned For
Owner Type
Purchase Details
Closed on
Aug 19, 2020
Sold by
5 Boro Ny Holding Inc
Bought by
Cheriza Rock
Current Estimated Value
Home Financials for this Owner
Home Financials are based on the most recent Mortgage that was taken out on this home.
Original Mortgage
$636,446
Outstanding Balance
$563,520
Interest Rate
2.9%
Mortgage Type
New Conventional
Estimated Equity
$213,075
Purchase Details
Closed on
Jan 24, 2020
Sold by
Fannie Mae
Bought by
5 Boro Ny Holding Inc
Purchase Details
Closed on
May 12, 2017
Sold by
Aiello Robert J
Bought by
Federal National Mortgage Association
Purchase Details
Closed on
Apr 15, 2002
Sold by
Adams Katheryne E and Gray Lanae
Bought by
Adams Katheryne E
Home Financials for this Owner
Home Financials are based on the most recent Mortgage that was taken out on this home.
Original Mortgage
$337,500
Interest Rate
7.13%
Mortgage Type
Purchase Money Mortgage
Purchase Details
Closed on
Mar 4, 1997
Sold by
Adams Katheryne E
Bought by
Adams Katheryne E and Gray Lanae
Create a Home Valuation Report for This Property
The Home Valuation Report is an in-depth analysis detailing your home's value as well as a comparison with similar homes in the area
Home Values in the Area
Average Home Value in this Area
Purchase History
| Date | Buyer | Sale Price | Title Company |
|---|---|---|---|
| Cheriza Rock | $650,000 | -- | |
| Cheriza Rock | $650,000 | -- | |
| 5 Boro Ny Holding Inc | $452,000 | -- | |
| 5 Boro Ny Holding Inc | $452,000 | -- | |
| Federal National Mortgage Association | $429,680 | -- | |
| Federal National Mortgage Association | $429,680 | -- | |
| Adams Katheryne E | -- | -- | |
| Adams Katheryne E | -- | -- | |
| Adams Katheryne E | -- | Long Island Title | |
| Adams Katheryne E | -- | Long Island Title |
Source: Public Records
Mortgage History
| Date | Status | Borrower | Loan Amount |
|---|---|---|---|
| Open | Cheriza Rock | $636,446 | |
| Closed | Cheriza Rock | $636,446 | |
| Previous Owner | Adams Katheryne E | $337,500 |
Source: Public Records
Tax History Compared to Growth
Tax History
| Year | Tax Paid | Tax Assessment Tax Assessment Total Assessment is a certain percentage of the fair market value that is determined by local assessors to be the total taxable value of land and additions on the property. | Land | Improvement |
|---|---|---|---|---|
| 2025 | $5,113 | $26,986 | $9,156 | $17,830 |
| 2024 | $5,113 | $25,459 | $8,513 | $16,946 |
| 2023 | $4,824 | $24,019 | $6,839 | $17,180 |
| 2022 | $4,622 | $40,860 | $12,540 | $28,320 |
| 2021 | $4,873 | $35,820 | $12,540 | $23,280 |
| 2020 | $4,760 | $34,260 | $12,540 | $21,720 |
| 2019 | $4,438 | $33,300 | $12,540 | $20,760 |
| 2018 | $4,080 | $20,016 | $9,843 | $10,173 |
| 2017 | $3,287 | $19,296 | $10,448 | $8,848 |
| 2016 | $3,236 | $19,296 | $10,448 | $8,848 |
| 2015 | $1,757 | $18,740 | $12,863 | $5,877 |
| 2014 | $1,757 | $17,680 | $12,281 | $5,399 |
Source: Public Records
Map
Nearby Homes
- 183-67 Dunlop Ave
- 183-09 Dunlop Ave
- 187-23 Brinkerhoff Ave
- 183-29 Brinkerhoff Ave
- 183-12 Elmira Ave
- 104-11 188th St
- 183-34 Fonda Ave
- 102-13 183rd Place
- 102-35 187th St
- 186-16 Hilburn Ave
- 10533 Farmers Blvd
- 10211 187th St
- 184-15 Henderson Ave
- 185-05 Henderson Ave
- 19027 109th Rd
- 188-31 Jordan Ave
- 10220 189th St
- 187-44 Jordan Ave
- 111-06 Farmers Blvd
- 10532 192nd St
- 183-45 Camden Ave
- 18349 Camden Ave
- 18341 Camden Ave
- 183-37 Camden Ave
- 18353 Camden Ave
- 18337 Camden Ave
- 18340 Babylon Ave
- 18336 Babylon Ave
- 18344 Babylon Ave
- 18357 Camden Ave
- 18333 Camden Ave
- 18332 Babylon Ave
- 183-48 Camden Ave
- 18348 Babylon Ave
- 18328 Babylon Ave
- 18361 Camden Ave
- 18329 Camden Ave
- 18348 Camden Ave
- 183-61 Camden Ave
- 183-61 Camden Ave Unit HOUSE